Fornitore ufficiale
In qualità di distributori ufficiali e autorizzati, forniamo licenze software legittime direttamente da più di 200 autori di software.
Vedi tutte le nostre marche

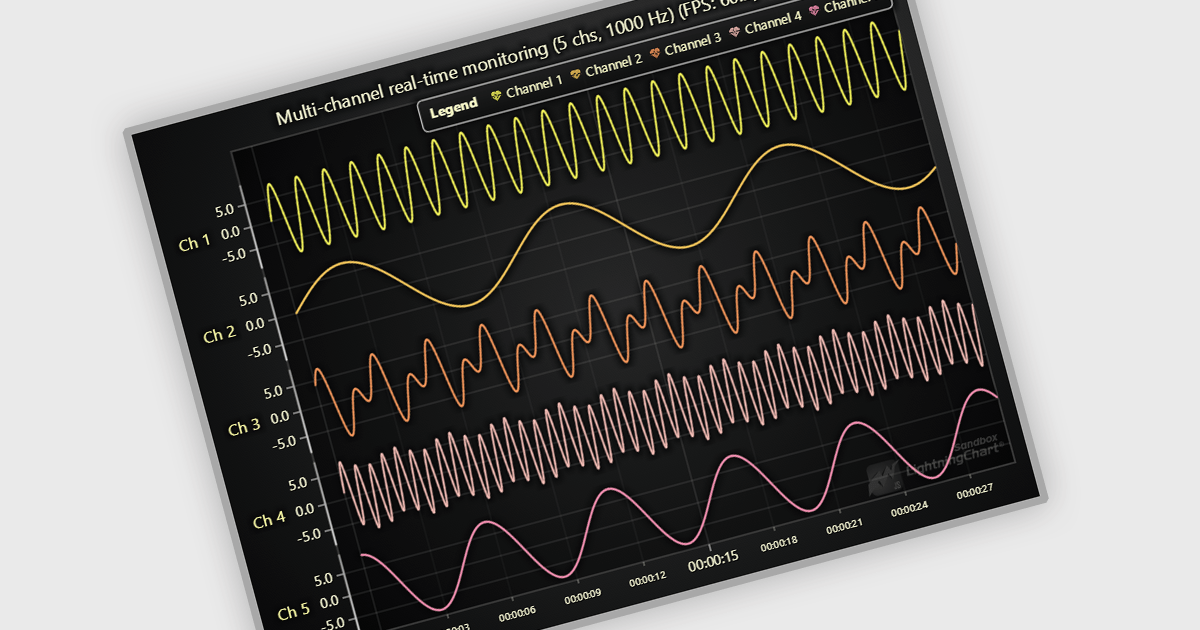
JavaScript API as a data source in React JavaScript Charts refers to the use of custom JavaScript functions or services that fetch and supply data dynamically to chart components at runtime, rather than relying on static datasets. This approach enables charts to reflect real-time data changes, support asynchronous operations, and integrate with external APIs or internal services. It is particularly useful for applications that require up-to-date information, such as dashboards, monitoring tools, or analytics platforms. The key advantage is enhanced flexibility and responsiveness, allowing developers to handle complex data flows, perform live updates, and tailor chart behavior based on interactive or conditional logic.
Several React Chart Controls offer support for using JavaScript API as a data source including:
For an in-depth analysis of features and price, visit our comparison of React Chart Controls.

ComponentSource has played a central role in broadening access to Sencha’s suite of development tools by making them more readily available to a global developer audience. Its distribution infrastructure has helped ensure that organizations - including many in the Fortune 100 - can obtain the tools they need to build and maintain complex, data-driven web applications across platforms.
For five years, ComponentSource has supported developers by providing a straightforward route to acquiring Sencha's products. This collaboration reflects a shared goal: to make software procurement simpler and more reliable, particularly for teams working on large-scale or multi-device applications.
Celebrating a successful 5-year journey, ComponentSource and Sencha look forward to further empowering development teams globally. This continued collaboration aims to enhance the availability and adoption of Sencha's tools, enabling even more organizations to build sophisticated web applications for diverse devices.
For more information, visit our Sencha brand page.

Stimulsoft Reports.JS provides a robust reporting toolkit designed specifically for JavaScript applications. This library leverages a client-side architecture, offering a pure JavaScript report engine for efficient report rendering directly within web browsers. The solution includes a user-friendly report designer for building reports with various data sources and visualizations, along with a report viewer for seamless integration and display within your JavaScript applications. This eliminates the need for server-side dependencies or browser plugins, simplifying the development process for embedding powerful reporting functionalities into your web projects.
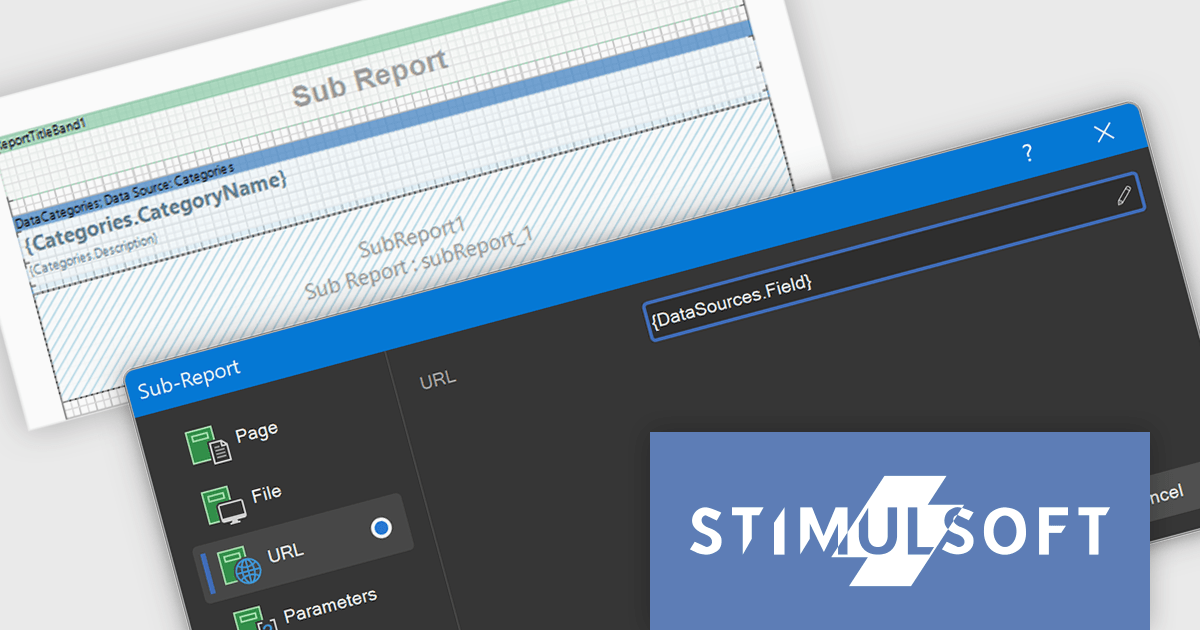
The Stimulsoft Reports.JS includes expressions within the URL and File fields of the Sub-Report component. This functionality helps developers to dynamically determine the source of a sub-report, whether it is a file path or a web address, based on the evaluation of expressions. Consequently, this allows for the creation of more adaptable and context-aware reports where the embedded sub-report content or linked resources are determined programmatically based on the main report's data, offering greater flexibility in report design and data integration without the need for static configurations.
Stimulsoft Reports.JS is licensed per developer and is available as a Perpetual license with 1 year support and maintenance. See our Stimulsoft Reports.JS licensing page for full details.
Stimulsoft Reports.JS is available individually or as part of Stimulsoft Ultimate.

ComponentSource has helped extend access to Froala's lightweight WYSIWYG HTML editor by making it available to developers around the world. The JavaScript-based editor integrates easily into web applications, offering straightforward rich text editing capabilities that fit well within ComponentSource's global catalog of developer tools.
The partnership between ComponentSource and Froala, now spanning five years, reflects a shared dedication to providing developers with high-quality and easily accessible software. This collaboration has created a reliable channel for developers to obtain Froala's products.
As they mark five years of working together, ComponentSource and Froala continue to support developers with accessible editing solutions. The availability of Froala Editor through ComponentSource underscores its position as a useful tool for modern web content editing, and strengthens ComponentSource’s role as a resource for trusted development components.
Froala Editor is licensed per product and domain. It is available as an annual or perpetual license with version upgrades and support. See our Froala Editor licensing page for full details.
For more information, visit our Froala Editor product page.

Stimulsoft Dashboards.JS is a JavaScript-based tool for creating interactive dashboards within web applications. Designed for developers and businesses, it provides customizable charts, graphs, and tables to visualize complex data from various sources. It supports popular JavaScript frameworks such as React, Vue.js, and Node.js, enabling seamless integration into modern web projects. With an intuitive interface and responsive design, it suits use cases like business intelligence, performance monitoring, and data-driven decision-making. Stimulsoft Dashboards.JS enhances user engagement and simplifies data analysis for industries such as finance, marketing, and logistics.
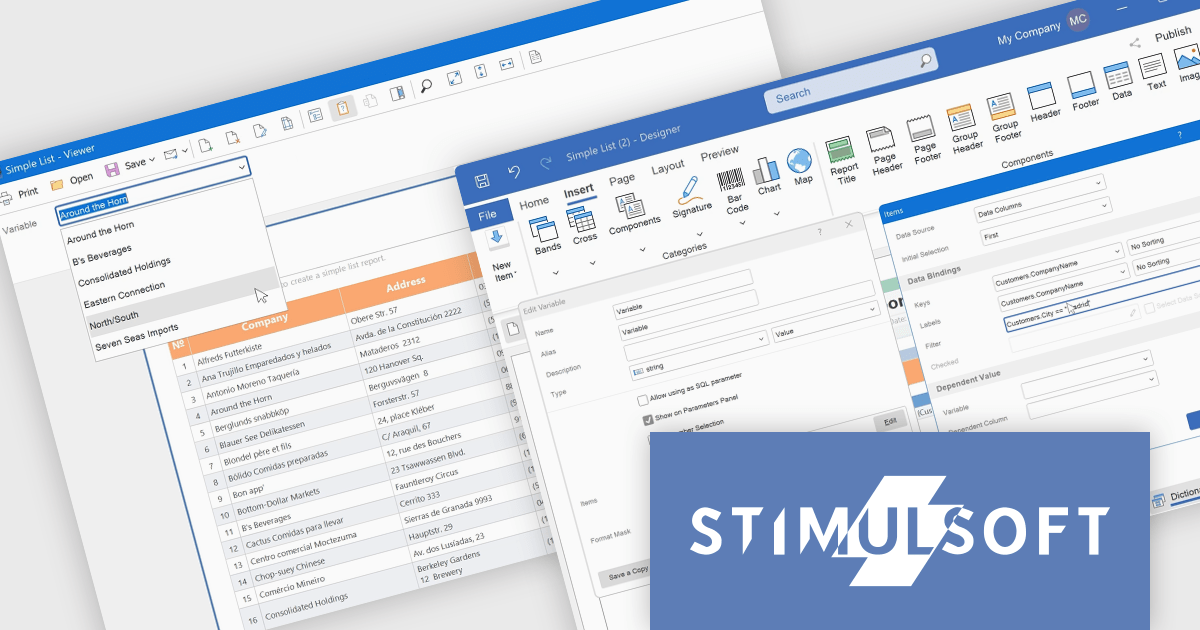
Stimulsoft Dashboards.JS includes the capability to filter variable values within the parameters panel of the viewer. This enhancement allows developers to provide end-users with a more refined and efficient parameter selection experience. By implementing expression-based filtering in the variable editor or Items window, only relevant data options are presented during report or dashboard viewing. This targeted presentation of variable values reduces visual clutter and improves the process of specifying report parameters, ultimately leading to improved usability and more focused data exploration for the end-user.
Stimulsoft Dashboards.JS is licensed per developer and is available as a Perpetual license with 1 year support and maintenance. See our Stimulsoft Dashboards.JS licensing page for full details.
Stimulsoft Dashboards.JS is available individually or as part of Stimulsoft Ultimate.