Nevron Chart for .NET 2018.1

Aggiunge una serie di mappe termiche triangolate, oltre a migliorare le caratteristiche dei grafici vettoriale, a bolle, a barre, ad area e a torta.
Ottobre 29, 2018
Nuova versione

Funzionalità

  • Triangulated Heat Map Series
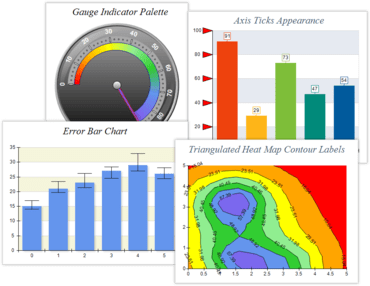
    • The Triangulated Heat Map Series adds support for drawing triangulated meshes of arbitrary XYZ points.
    • The X/Y coordinates of the point are used to determine the point location on the X and Y axes whereas the Z coordinate is used to specify the point elevation. The series also support contour with configurable stroke and label style.
  • Bubble Series Improvements
    • Adds support for bubble size scale - this is a legend mode which shows a map of different bubble sizes and their values.
    • Adds support for Bubble Palette - this is a pallete object which can be attached to the bubble series and defines coloring for the bubbles depending on their size.
  • Vector Series Improvements
    • Adds support for vector size scale - this is a legend mode which shows a map of different vector sizes and their values.
    • Adds support for a special drawing mode which allows you to scale vector lengths - this allows you to plot vectors with small lengths.
  • Bar Series Improvements
    • Adds support for error bars and control over the bars pixel snapping (EnableXPixelSnapping and EnableYPixelSnapping properties).
  • Area Series Improvements
    • The Stacked Area Series now supports negative values (AllowNegativeStackValues property).
  • Pie Series Improvements
    • Added feature to control the width of pie segments per segment - BeginWidthPercent and EndWidthPercent.
  • Common Series Improvements
    • All cartesian series now support a feature to control whether the series regards the axis clipping options.
    • All cartesian series now support the Z order property which allows you to specify the drawing order of the series without moving it in the series collection.
  • Axis and Scale Improvements
    • Added feature to specify that scale decorations (ticks, labels etc.) should be rendered in front or back of the back chart wall.
    • Added feature to control how axis labels fit inside the chart panel bounds. You can select whether to regard the axis height, height and width or to automatically select the best mode.
    • Added control over the tick shape for cartesian scales.
  • Linear / Radial Gauge Improvements
    • Linear and Radial gauge indicator support a palette object. The palette can either spread over the indicator or the current indicator palette value can be used to color the indicator.
  • Performance Optimizations
    • Optimized chart min max calculations and cache.
    • Optimized Legend items measurement and cache.
  • Other Improvements
    • Added ability to specify the type of exported EMF format - EmfPlus, EmfDual or EmfOnly.
    • Added ability to specify modifier keys for drag tools (NMouseAction also accepts a collection of modifier keys).
    • Added support for texture filling content alignment
  • Various Stability and Performance Improvements
    • Fixes all reported problems as well numerous small performance improvements in the control.
  • Support for Visual Studio 2017
    • Nevron Vision for .NET now provides full support for Visual Studio 2017.
Nevron Chart for .NET.

Nevron Chart for .NET

Aggiungi ricche funzionalità di creazione di grafici alle tue applicazioni WinForms e ASP.NET.

Hai una domanda?

Chatta live con i nostri specialisti di gestione delle licenze di Nevron ora.