
Fornitore ufficiale
In qualità di distributori ufficiali e autorizzati, forniamo licenze software legittime direttamente da più di 200 autori di software.
Vedi tutte le nostre marche
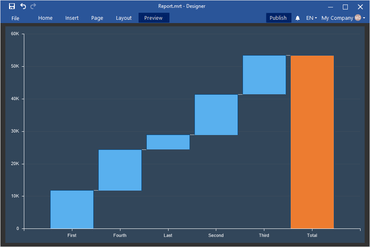
Un generatore di report facile da usare per JavaScript.
Chatta live con i nostri specialisti di gestione delle licenze di Stimulsoft ora.

Distributore ufficiale da 2008
Tel: (888) 850 9911
Fax: +1 770 250 6199


