Stimulsoft Reports.Web 2020.2.1

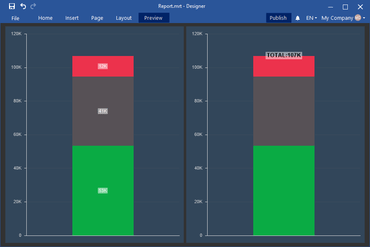
Aggiunge la possibilità di mostrare il risultato complessivo per i grafici ad area in pila.
Febbraio 6, 2020
Nuova versione

Funzionalità

  • New Waterfall Chart - A waterfall chart is used to display a running total when you add or remove values.
  • Overall Results for Stacked Area Charts - This release adds the ability to display the total for each argument in a Dashbaord Stacked Area chart.
  • Dark Green Theme for Dashboards - To apply the new style, select the Dashboard and select the Dark Green theme from the styles menu.
Overall result for Stacked Area charts

Stimulsoft Reports.WEB

Aggiungi report flessibili e ricchi di funzionalità alle tue applicazioni Web.

Stimulsoft Reports.WEB è disponibile anche in:

Hai una domanda?

Chatta live con i nostri specialisti di gestione delle licenze di Stimulsoft ora.