Syncfusion Essential Studio for JavaScript 2020 Volume 1

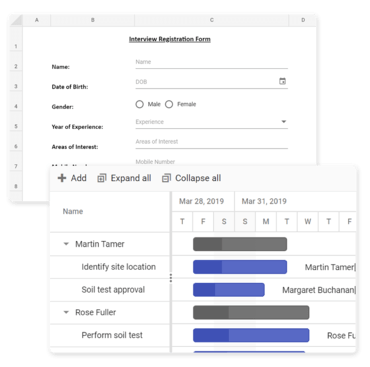
Aggiunge il supporto della visualizzazione risorse per il controllo Diagramma di Gantt.
Aprile 2, 2020
Nuova versione

Funzionalità

Kanban (preview)

  • The Kanban component is used to visually organize and prioritize your work, and also for workflow transparency. The component is widely used in real-time task scheduling such as for software and product development, project management, and task planning.

Dropdown Tree (Preview)

  • A preview version of the new Dropdown Tree control is now available for the ASP.NET Core suite. This control allows you to select single or multiple values from hierarchical data in a tree-like structure. It has several out-of-the-box features, such as data binding, check boxes, templates, UI customization, accessibility, and preselected values.

Progress Bar (Preview)

  • A new progress bar control has been introduced. This is used to visualize the changing status of an extended operation such as a download, file transfer, or installation. It also represents the progress with text format as percent.

Bullet Chart

  • Legend - Allows users to add a legend for targets, actual values, and ranges in bullet charts.

Chart

  • Highlight and patterns - Enables users to highlight data points and apply patterns to highlighted and selected points.

Circular Gauge

  • Print and export - The rendered circular gauge can be printed or exported to PNG, JPEG, SVG, and PDF formats.
  • Range drag - Change the range values of the circular gauge by dragging.
  • Start and end width support in needle pointer - Customize the start and end width of the needle pointer.

Diagram

  • Dot pattern support for gridlines - This feature allows users to set the diagram grid pattern to dots in addition to the existing straight-lines grid pattern.
  • Native template support for HTML shapes - This feature allows users to set the native template to HTML shapes in addition to the existing string template. Users can customize the look and feel of the template for each node, resulting in a better user experience and more flexibility.

Word Library

  • Unlink fields - Word Library now allows replacing a field with its most recent result in the Word document by unlinking the field. When you unlink a field, its current result is converted to text or a graphic and can no longer be updated automatically.
  • Word-to-PDF enhancements - Word Library now provides the following features in Word-to-PDF conversions:
    • Adjust table cell size automatically based on its content during PDF conversion.
    • Keep-with-next functionality for paragraphs inside the content control.
    • Position floating items (images, shapes) with horizontal origins relative to characters.
    • Improvements in converting a Word document into a 508-compliant accessible PDF (tagged PDF) document.

Word Processor

  • Web layout - Enables users to view documents as they would appear in a browser.
  • Word Processor server library in Java - Allows users to convert Word documents (DOCX) to SFDT format (Syncfusion Document Text) in Java.
  • Toolbar customization - Enables users to customize (add, show, hide, enable, and disable) the existing items in a toolbar.

File Manager

  • IBM Cloud Object Storage - The IBM Cloud Object Storage service provider helps users manage files in the File Manager control.

Gantt Chart

  • PDF export - Export the Gantt Chart data to a PDF document.
  • Manual task scheduling - Manually schedule tasks without any child/predecessor task dependencies. Also, change the mode of each task dynamically from auto to manual and vice versa.
  • Resource units - Resource units indicate the amount of work that can be done by the resources for a particular task in a day.
  • Resource view - Visualize the list of tasks assigned to each resource in hierarchical manner. Add or remove one or more resources from each task.
  • Work - Work is denoted as the total hours required to complete a task. Work depends on the resources unit and duration of a task.

DataGrid

  • Infinite scrolling - Infinite scrolling allows users to load data using the lazy loading concept. This means that the buffered data will be loaded only when the scrollbar reaches the end of the scroller. Along with that, some customization options to persist data and DOM elements, like cache the loaded data, the number of rows maintained in a grid, and the number of rows to be rendered at DataGrid initialization, have been provided.
  • Virtualization with inline and dialog editing - Use inline and dialog editing in virtualization-enabled DataGrid.

HeatMap Chart

  • Multiple rows - Provided multiple rows support for x axis. Now, the excess text will not overlap the text in the next column.
  • Trim support - Provided trim support for both the axes (X and Y).
  • Print and export - Provided print and export support. HeatMap can be exported in PDF and image formats.

Linear Gauge

  • Print and export - The rendered linear gauge can be printed or exported to PNG, JPEG, SVG, and PDF formats.

Maps

  • Export tile maps - Support to export the maps rendered from the providers such as OSM, Bing, and Google to the supported formats.
  • Toggle panning functionality - Provided an option to enable or disable the panning functionality in Maps.
  • Complex data source - Complex data in the data sources can now be parsed and utilized in the Maps control for bubbles, markers, color mapping, and more.

PDF Viewer

  • Redis cache for PDF Viewer service - Provided Redis cache support for the PDF Viewer .NET Core web service.

Pivot Table

  • UI enhancement - The design of the Pivot Table have been enhanced for a more compact view. The cells can also now be differentiated by their background colors. These enhancements have been done for all the themes: Material, Fabric, Bootstrap, Bootstrap v4, and high contrast.
  • “Distinct Count” - Aggregation support for string data type - Now the aggregation type “Distinct Count” has support for the string data type along with the existing aggregation type “Count”. The aggregation types can be switched dynamically with a drop-down available in the grouping bar and field list when the field is bound in the value axis.
  • Customize the button options in grouping bar and field list - In the grouping bar and field list, users can customize button options: show or hide icons (sort, filter, remove, aggregate), restrict drag of a particular field, restrict drop to a particular axis, etc.
  • Show desired aggregation types in the context menu - Instead of displaying all aggregation types, users can add selected aggregation types to the built-in context menu based on their application requirements.
  • Drill-through and editing support in pivot chart - Users can view raw items in a separate dialog by clicking on a chart series similar to a pivot table. In addition, users can also edit, add, and remove raw items and display the result in a pivot chart with the help of editing support.
  • Authentication option to access OLAP cube - Users can now set credentials in a report to access the OLAP cube connected to the Pivot Table.
  • Tooltip template - Users can design their own tooltip with a tooltip template. One can be used for both the Pivot Table and Pivot Chart or each can be set individually.
  • Format calculated fields - An option is included in the calculated field dialog to dynamically format the new field. You can also view and edit the format of the existing calculated fields with the option.
  • Multiple axes option set by UI - An option is included in the built-in toolbar to display a pivot chart either with a single axis or multiple axes.
  • Show desired chart types in its context menu - Instead of displaying all chart types, users can add selected chart types to the built-in context menu based on their application requirements.
  • Sort option in member editor - Sorting options such as default, ascending, and descending are included in the member editor to sort its members. It sorts out only the members inside the dialog and not the Pivot Table.
  • Edit option in calculated field button - An edit option is included in the button that represents the calculated field in the grouping bar and field list. It opens the calculated field dialog in edit mode so you can make changes.

Scheduler

  • Render more resource rows and choose to hide the whitespace between appointments.
  • Use a public method to scroll to a specific resource when there are a large number of resources.
  • Set a single appointment to occupy the entire height of a cell.
  • Update view-based settings with a public method.

Spreadsheet

  • Insert/delete rows and columns - This feature allows users to insert/delete rows and columns in a spreadsheet.
  • Show/hide rows and columns - This feature allows users to show/hide rows and columns in a spreadsheet.
  • Border - You can add borders around a cell or range of cells to define a section of a worksheet or a table.
  • Wrap text - Wrap text allows you to display large content as multiple lines in a single cell.
  • Protect sheet - Protect sheet provides an option to restrict user actions like cell editing, inserting rows and columns, deleting, and resizing.
  • Data validation - Support to validate edited values based on data validation rules defined for a cell.
  • Find and replace - This feature allows users to search and replace the content of a cell.
  • Merge cell - This feature allows users to span two or more cells in the same row or column into a single cell.
  • Cell template - This feature allows users to insert custom elements like a button, check box, radio button, date picker, and more into a cell or range of cells.

TreeGrid

  • Clipboard - Copy the TreeGrid records with and without headers to the clipboard including four hierarchy copy mode options: parent, child, both, and none.
  • Batch editing - Bulk add, edit, and delete records in a single request.

Excel Library

  • Pivot table enhancements - Format and convert pivot table cells with background color, foreground color, borders, fonts, etc. Also create, edit, and convert the following pivot table layouts:
    • Tabular layout
    • Outline layout
Resource view support for the Gantt Chart control

Syncfusion Essential Studio JavaScript

Una raccolta completa dell'interfaccia utente per JavaScript.

Hai una domanda?

Chatta live con i nostri specialisti di gestione delle licenze di Syncfusion ora.