Stimulsoft Dashboards.JS 2021.3

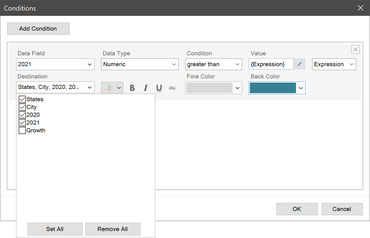
Aggiunge la possibilità di utilizzare le espressioni durante la formattazione condizionale degli elementi della Tabella della dashboard.
Maggio 19, 2021
Nuova versione

Funzionalità

  • Added the View States property to the Chart Element which helps with switching between the different settings of the chart element.
  • Added the ability to use an expression when formatting the "Table" element in dashboards conditionally.
  • An expression can now be specified in the Visible property of the table column in the table element.
  • Added the ability to select columns of the "Table" element to display when viewing the dashboard in the viewer.
  • Added the ability to sort items in the data dictionary.
  • Added the ability to align totals for the columns of the "Table" element in dashboards.
  • Added the ability to set default values for variables of the "List" type.
  • Added the ability to display the value of a regional map as bubbles in dashboards.
  • Added a map of Afghanistan for the "Map" component in reports and the "Region Map" element in dashboards.
  • Added animation for displaying Stacked Area and Full Stacked Area charts.
  • Updated and optimized the "Pivot" element in the web viewer and designer.
  • Updated icons and logos for applications and services.
  • Updated some commands in the report wizards.
  • Added the ability to customize the range of values for the icon of the "Indicator" element, in cases when it contains "Series".
Conditional formatting

Stimulsoft Dashboards.JS

Crea dashboard per la piattaforma JavaScript.

Hai una domanda?

Chatta live con i nostri specialisti di gestione delle licenze di Stimulsoft ora.