Vizuly Professional
JavaScript 앱에 차트 및 시각화를 추가 합니다
- Corona, Halo, Radial Bar, 가중 트리 등 다양한 종류의 차트 유형
- React, Angular 및 Vue.js 프레임워크를 포함 합니다 - 또는 퓨어 JavaScript로 사용 할 수 있습니다
- 픽셀-퍼펙트 시각화를 위해 쉽게 수정 및 맞춤화 할 수 있도록 처음부터 디자인 하였습니다

설명: Software Developer Tools Collection for Any Platform and Technology. Telerik DevCraft Complete includes more than 1,250.NET and JavaScript UI components that enable you to build modern, feature-rich and high-performing Web, desktop and mobile apps. Plus, ... 더 읽기

설명: Build modern apps with sleek UI. Telerik DevCraft UI provides.NET and JavaScript technologies to deliver outstanding UI with a broad array of styling and customization. Telerik DevCraft UI is for developers who build.NET and JavaScript apps and need sleek ... 더 읽기

설명: JavaScript, HTML5 UI widgets for responsive web and data visualization. Kendo UI is a bundle of four JavaScript UI libraries built natively for jQuery, Angular, React and Vue. Each library allows you to quickly build high quality, high performance ... 더 읽기

설명: Software Developer Tools Collection for Any Platform and Technology. Telerik DevCraft Complete includes more than 1,250.NET and JavaScript UI components that enable you to build modern, feature-rich and high-performing Web, desktop and mobile apps. Plus, ... 더 읽기

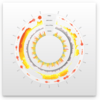
설명: A radial line and area layout visualization. Vizuly Corona is a radial chart that provides angular and curved radial area line curves and supports both an overlap and stacked layout. It also features over a dozen different dynamic styles and comes bundled ... 더 읽기

설명: Represent transactional relationships from a specified number of sources to a variable number of targets. Vizuly Halo uses several different data visualization techniques to represent transactional relationships from a specified number of sources to a ... 더 읽기

설명: Represent cartesian x/y data within a radial plot. Vizuly Radial Bar is designed to represent cartesian x/y data within a radial plot. It supports both clustered and stacked radial bars Use the interactive style explorer on the left to view different ... 더 읽기

설명: Easily display multi-variate time series information. Vizuly Ring Chart lets you easily display multi-variate time series information. Due to its radial form factor, you can display 3 times the information for a given screen width than you could with a ... 더 읽기

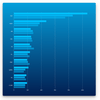
설명: Add stacked and clustered bar charts to your JavaScript apps. Vizuly Bar Chart supports both stacked and clustered layout options, as well as over 2 dozen different dynamic styles. It also comes bundled with a test container and examples of different ... 더 읽기

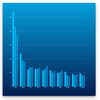
설명: Add stacked and clustered column charts to your JavaScript apps. Vizuly Column Chart supports both stacked and clustered layout options, as well as over 2 dozen different dynamic styles. It also comes bundled with a test container and examples of ... 더 읽기