













공식 공급 업체
200 이상의 소프트웨어 개발처와 판매 계약을 맺은 공인 디스트리뷰터로서 합법적인 라이선스를 제공합니다.
모든 브랜드 보기.
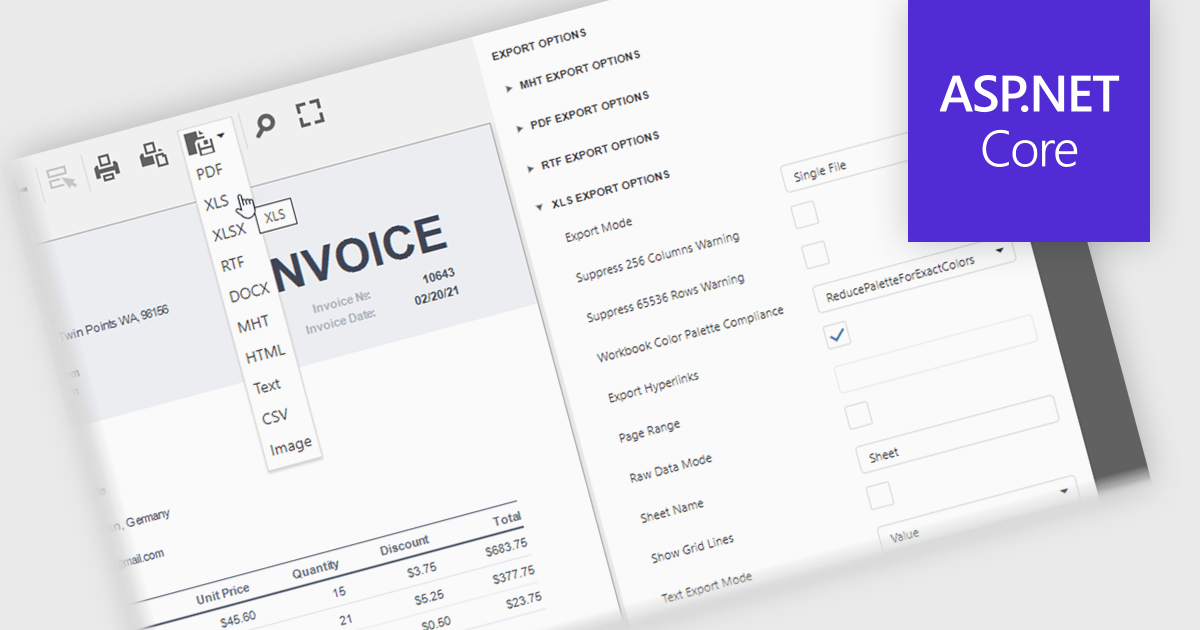
XLS/XLSX export in an ASP.NET Core reporting component allows generated reports to be saved in Microsoft Excel spreadsheet formats while preserving data, formatting, formulas and worksheet structure. This makes it straightforward for users to open report data in Excel for further analysis, filtering, sorting, calculations, or sharing, while giving developers a reliable way to deliver report output in a widely supported business format that integrates well with existing workflows and office productivity tools.
Several ASP.NET Core reporting controls offer export to XLS/XLSX including:
For an in-depth analysis of features and price, visit our ASP.NET Core reporting controls comparison.
Stimulsoft Ultimate is a reporting and dashboard solution that provides a set of tools for building interactive reports and data visualizations across platforms, including WinForms, ASP.NET, .NET Core, Blazor, JavaScript, WPF, PHP, Java, and Avalonia. It enables developers and organizations to design, generate, and deploy professional reports and dashboards using visual designers, flexible styling options, rich charting and data visualization components, and extensive data connectivity. With support for multiple development environments and technologies, Stimulsoft Ultimate helps teams improve report creation, maintain consistent designs, and deliver clear, data-driven insights for business intelligence, analytics, operational reporting, and enterprise applications.
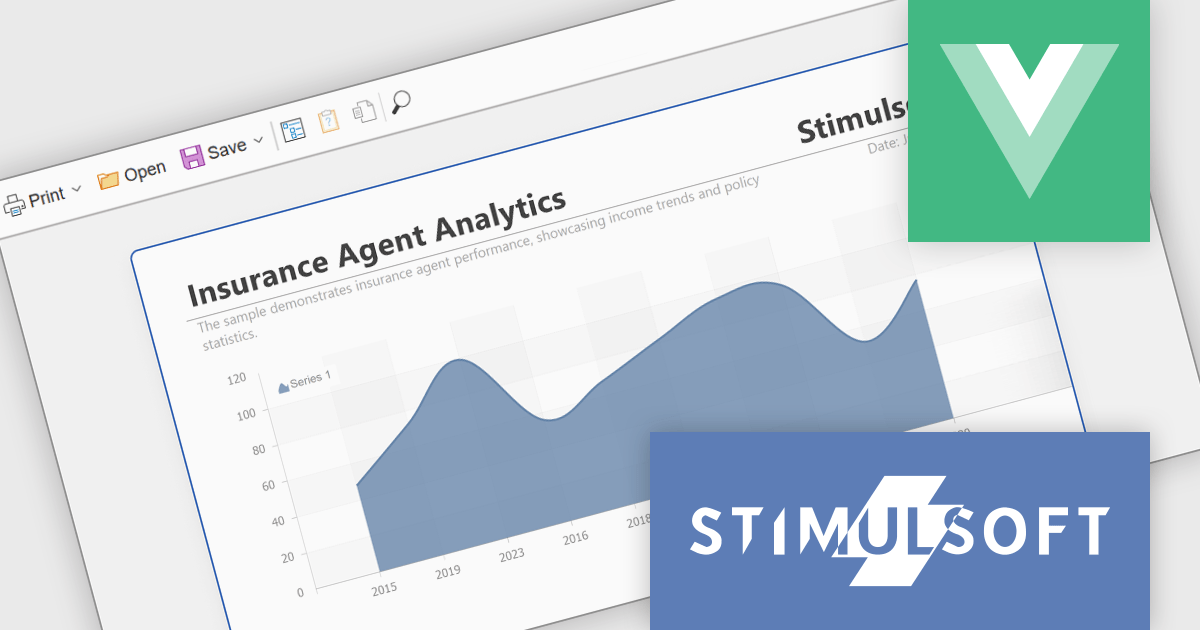
The Stimulsoft Ultimate 2026.3.1 release adds a report viewer for Vue.js, giving developers a native way to integrate report viewing into modern Vue applications without relying on generic web components or framework workarounds. This provides a more consistent development experience, making it easier to embed interactive reports, maintain application architecture, and deliver responsive user interfaces. For organizations building new single-page applications or modernizing existing systems with Vue.js, the new viewer offers greater flexibility when incorporating reporting capabilities while helping to reduce integration effort.
To see a full list of what's new in 2026.3.1, see our release notes.
Stimulsoft Ultimate is licensed per developer with Single, Team, Enterprise, and WorldWide options that support one to unlimited developers within an organization. Licenses include a 12 month subscription with updates, priority technical support, a royalty free runtime report designer and viewer, and a build server license for Team and higher tiers. See our Stimulsoft Ultimate licensing page for full details.
Learn more on our Stimulsoft Ultimate product page.
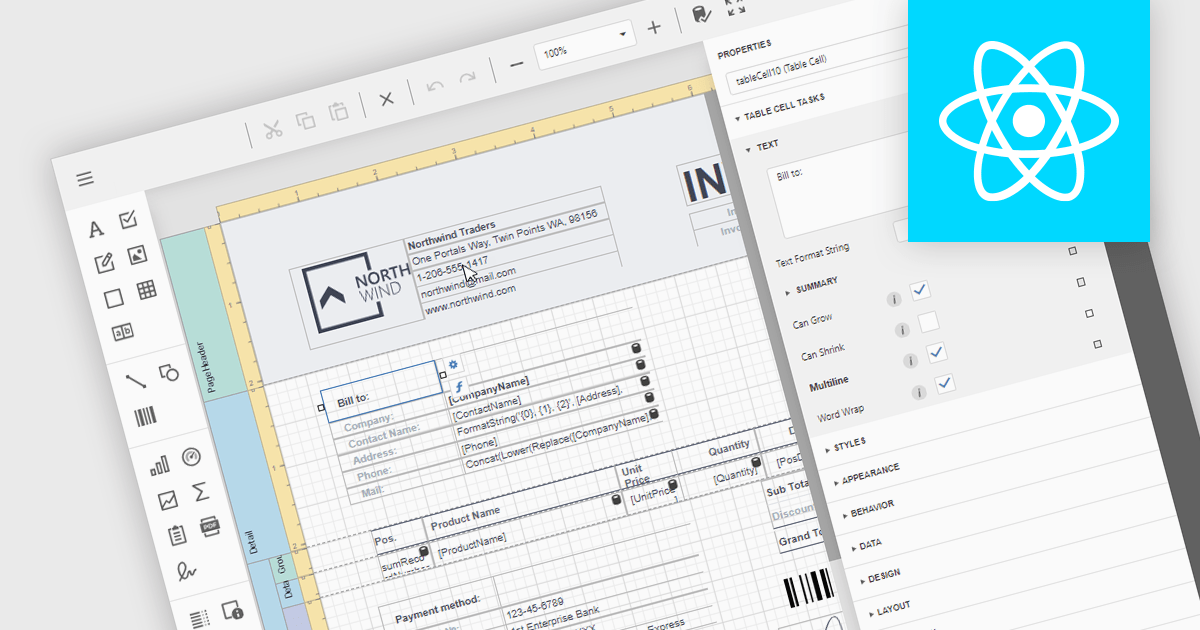
An end user report designer is a visual tool that allows non-technical users to create, edit, and customize report layouts directly within an application, without needing to write code or rely on developers. Typically featuring an intuitive drag-and-drop interface, it enables users to arrange data, apply formatting, configure layouts, and define filters and expressions to meet changing business requirements. This allows organizations to deliver reporting changes more quickly, gives users greater control over their reporting needs, and enables development teams to focus on more complex application work.
Several React reporting components provide you with an end user report designer, such as:
For an in-depth analysis of features and price, visit our comparison of React reporting components.
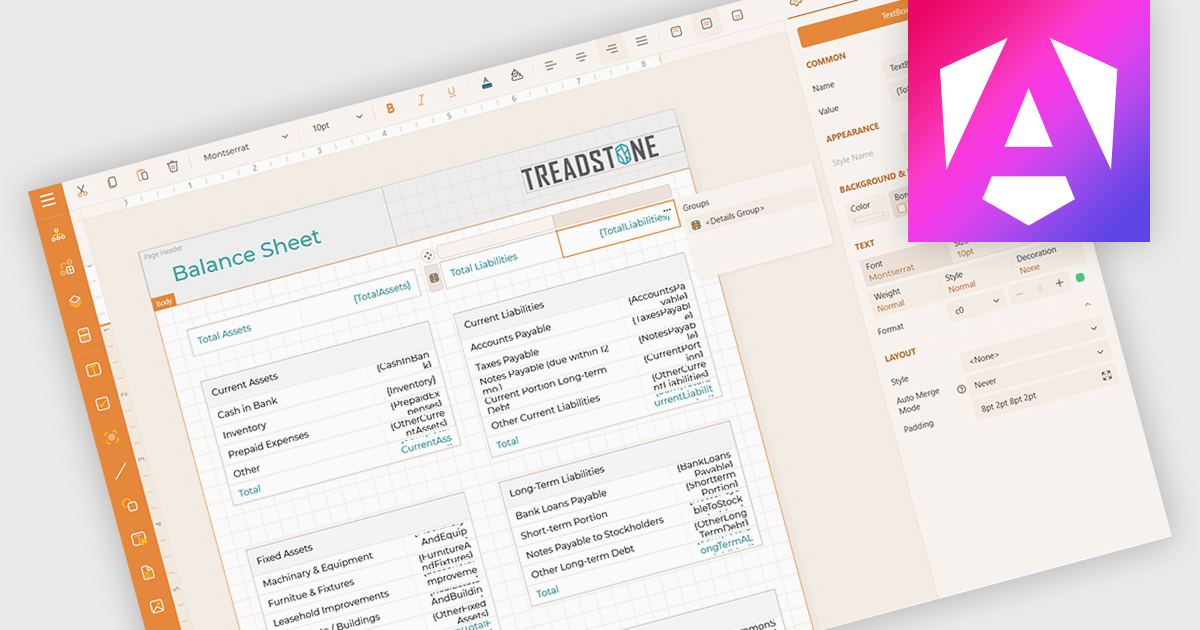
Calculated field support in a reporting component allows developers to define custom values by applying expressions, formulas, or functions to existing data without changing the underlying data source. This makes it possible to derive metrics such as totals, percentages, conditional values, or formatted output directly within a report, reducing the need for additional database queries or application logic. The result is greater flexibility when designing reports, faster adaptation to changing reporting requirements, improved report maintainability, and more consistent business calculations across reports.
Several Angular reporting controls offer support for calculated fields including:
For an in-depth analysis of features and price, visit our comparison of Angular reporting controls.
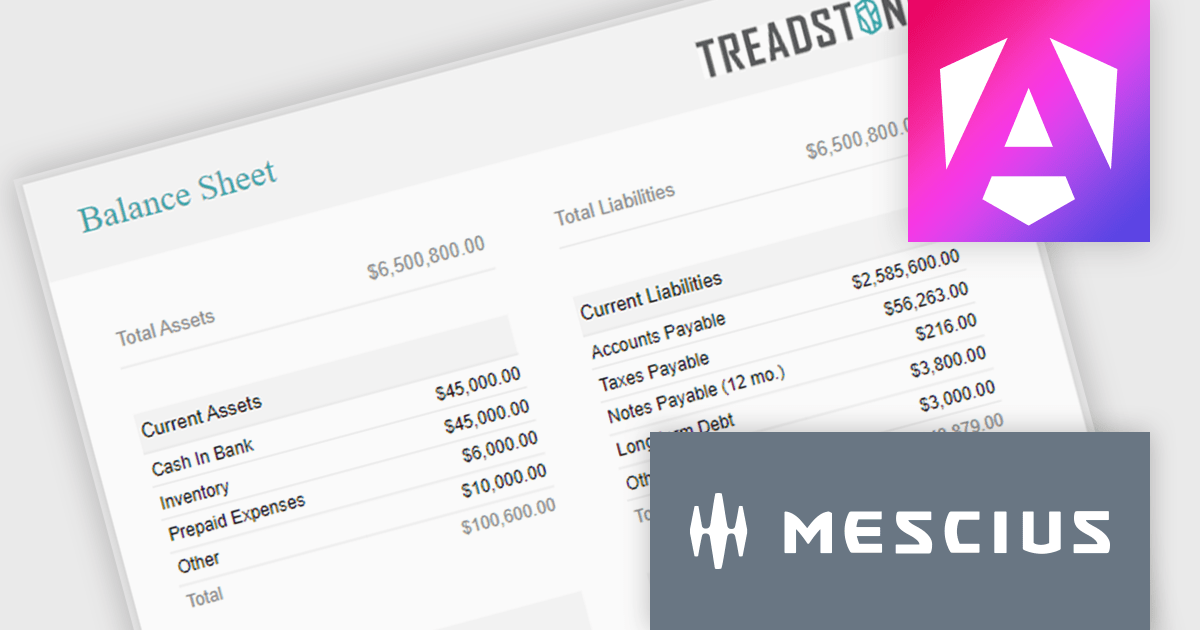
ActiveReportsJS is a powerful, lightweight reporting tool designed to integrate advanced reporting capabilities into any JavaScript application. ActiveReportsJS enables developers to create, view, export, and print richly formatted reports entirely on the client side - with zero server dependencies.
Balance sheets provide a snapshot of an organization's financial position at a specific point in time. By summarizing assets, liabilities, and equity, these reports help creditors, investors, and stakeholders evaluate a company's financial health. In this blog post, MESCIUS Product Manager Joel Parks demonstrates how to use the Angular Report Designer to give users the ability to design, view, and interact with reports directly from within your web application. Steps include:
Read the complete blog to get started creating polished, interactive balance sheets within your web applications.
ActiveReportsJS is licensed on an annual subscription or perpetual basis and is available as a Single Deployment License for non-commercial use, and as a Single Domain License or Unlimited Domain License for commercial and/or SaaS use. See our ActiveReportsJS licensing page for full details.
For more information, visit our ActiveReportsJS product page.
전화 : 00798 14 800 6332
팩스 : +1 770 250 6199


