


공식 공급 업체
200 이상의 소프트웨어 개발처와 판매 계약을 맺은 공인 디스트리뷰터로서 합법적인 라이선스를 제공합니다.
모든 브랜드 보기.
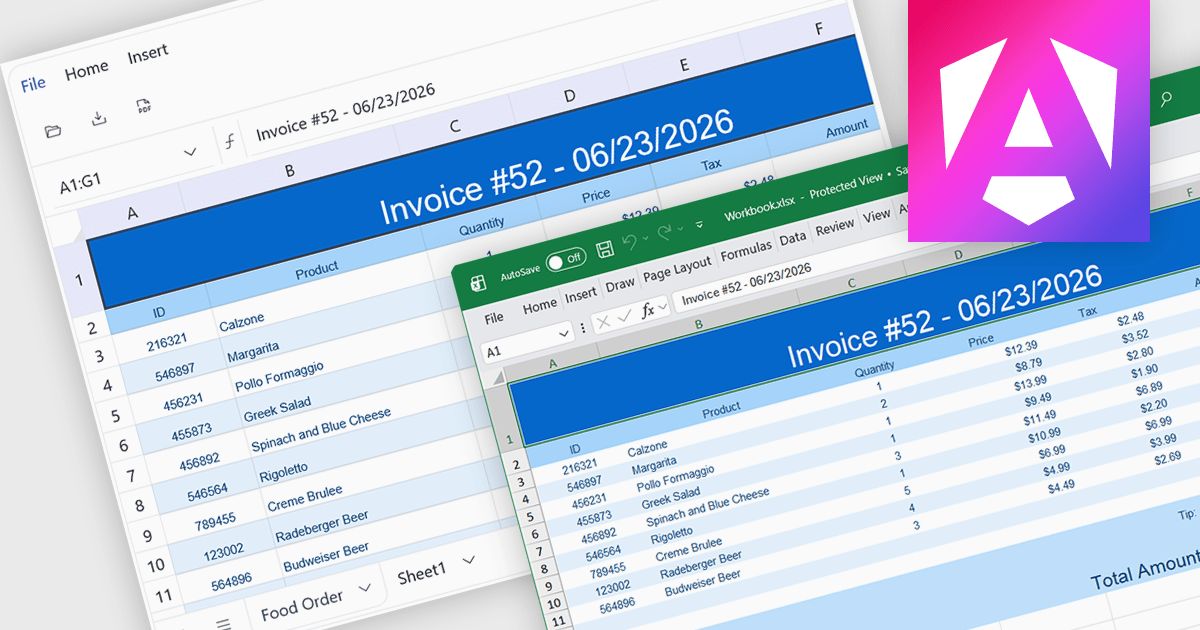
Exporting to XLSX in a spreadsheet component is the ability to generate Microsoft Excel Open XML Spreadsheet (.xlsx) files directly from application data or the current spreadsheet state, allowing users to save, share, and open content in Microsoft Excel and other compatible spreadsheet applications. For software developers, this provides a reliable way to deliver data in a widely supported format while preserving features such as worksheets, formulas, formatting, tables, and cell styles where supported, making it easier to integrate reporting, data exchange, and offline analysis into applications without requiring users to manually recreate or copy spreadsheet content.
Several Angular spreadsheet controls offer support exporting to XLSX including:
For an in-depth analysis of features and price, visit our Angular spreadsheet controls comparison.
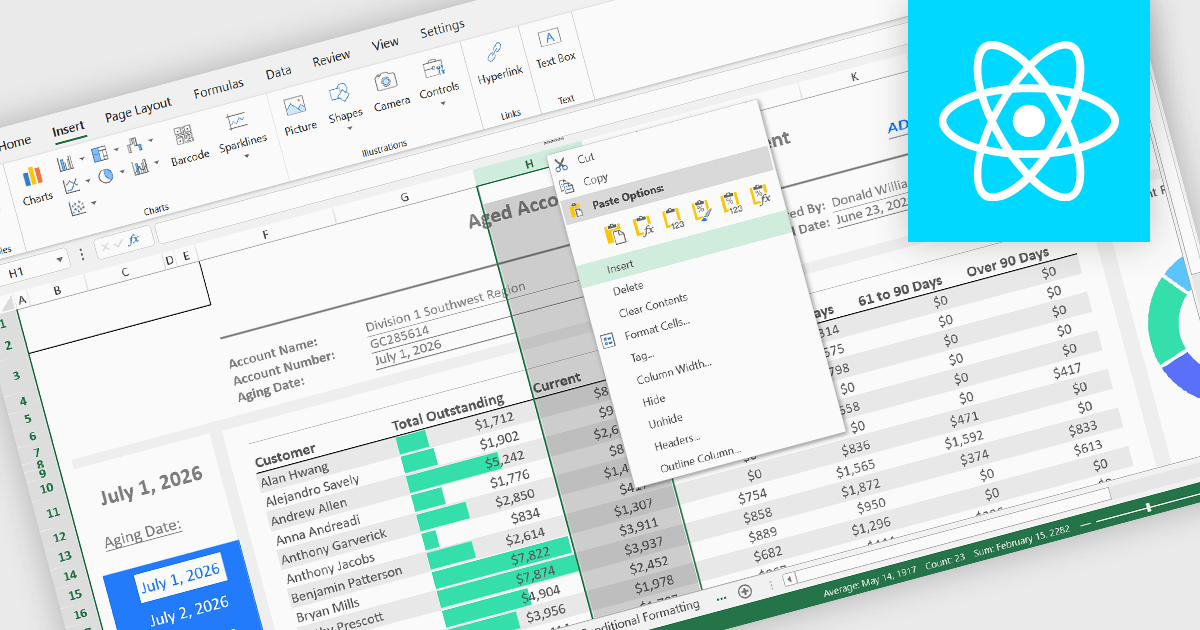
Inserting columns is a fundamental spreadsheet capability that allows users to add new columns at any position within a worksheet without disrupting existing data. This feature helps accommodate changing requirements, making it easier to expand datasets, introduce new calculations, capture additional information, and reorganize content while maintaining the overall structure of the spreadsheet.
Several React spreadsheet controls offer the ability to insert columns, including:
For an in-depth analysis of features and price, visit our React spreadsheet controls comparison.
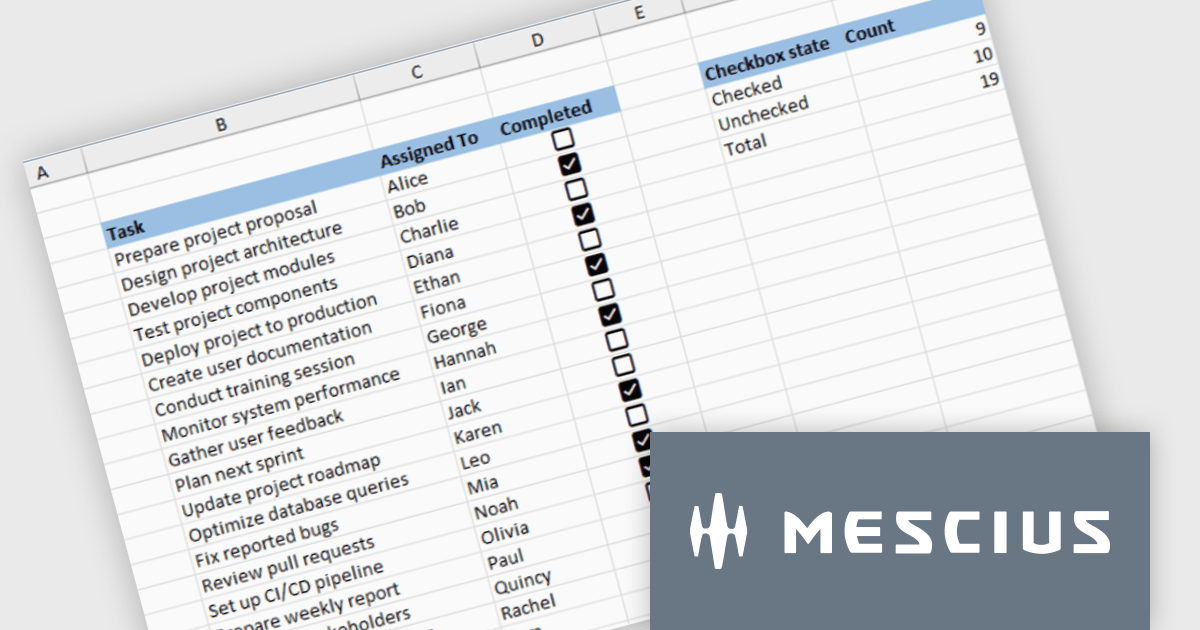
Document Solutions for Excel by MESCIUS is designed to enable developers to create and manipulate Microsoft Excel documents programmatically. It provides a robust API for interacting with Excel spreadsheets, allowing developers to automate tasks such as data extraction, formatting, and generation of reports. The framework offers comprehensive support for various Excel features, including formulas, charts, conditional formatting, and data validation. It also provides tools for handling large datasets and optimizing performance, making it suitable for both small-scale and enterprise-level applications.
Document Solutions for Excel enables developers to add interactive checkboxes directly within worksheet cells, ensuring they remain synchronized with the underlying data during sorting, filtering, and row operations. By embedding checkbox controls into cells rather than using separate form elements, developers can create more reliable Excel style checklist experiences with less complexity, while maintaining compatibility across exports and supported file formats.
Document Solutions for Excel is licensed per developer and is available in several license options for differing distribution needs. Team licenses are also available for multiple developers within the same organization. See our Document Solutions for Excel, .NET Edition licensing page for full details.
Document Solutions for Excel Editions are available to buy in the following products:
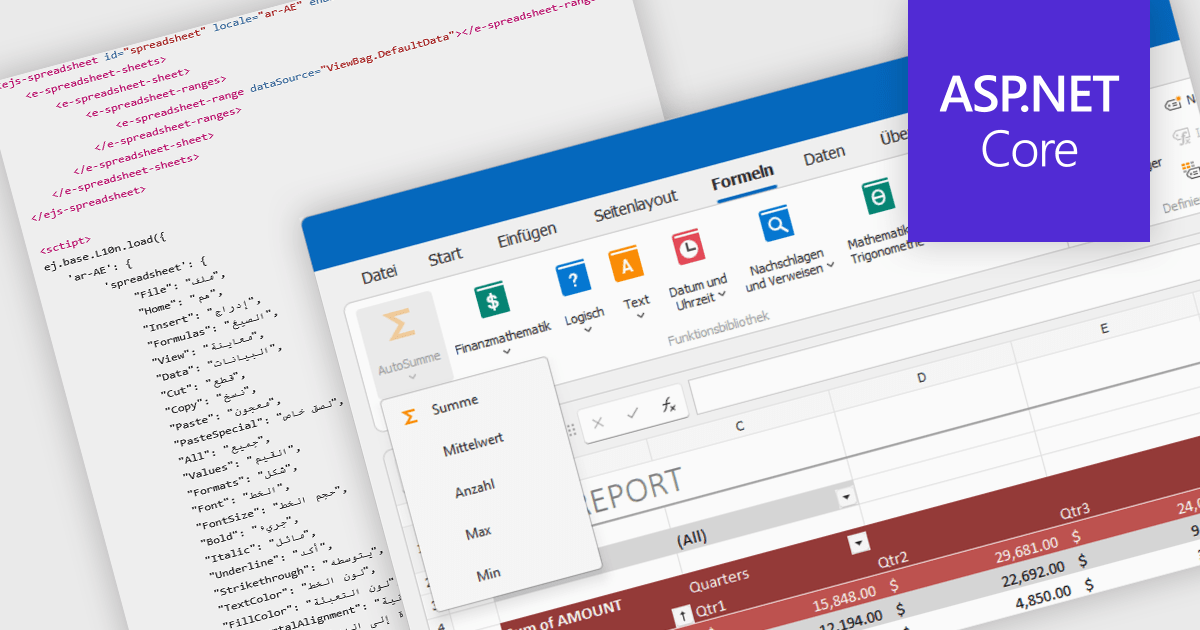
Localization in spreadsheet components enables applications to present spreadsheet interfaces, menus, dialogs, functions, and user-facing messages in the user's preferred language and regional format. This helps organizations deliver a more familiar and accessible experience to global audiences while supporting regional conventions such as date formats, number formatting, currencies, and translated interface elements. By adapting the spreadsheet environment to different languages and cultures, localization can improve usability, reduce training requirements, and help applications meet the expectations of international users.
Several ASP.NET Core spreadsheet controls offer support for localization including:
For an in-depth analysis of features and price, visit our ASP.NET Core spreadsheet controls comparison.

For the past three years, ComponentSource and Jspreadsheet have worked together to provide developers with powerful spreadsheet and data management solutions for modern web applications. Jspreadsheet offers Excel like functionality for JavaScript, React, Angular, and Vue applications, helping teams create interactive data grids, forms, dashboards, and business applications that can handle large volumes of data with exceptional performance.
A key product in this collaboration is Jspreadsheet Pro, the brand’s flagship spreadsheet component. Featuring more than 400 built in formulas, advanced data handling capabilities, and extensive customization options, it enables developers to deliver familiar spreadsheet experiences directly within their web applications while maintaining full control over data integration and persistence.
This partnership helps ComponentSource differentiate its product offering by providing customers with a market leading spreadsheet solution that complements its extensive portfolio of developer tools. Through ComponentSource’s global sales, licensing, and support services, developers worldwide can easily discover, evaluate, purchase, and deploy Jspreadsheet Pro within their projects.
Learn more about Jspreadsheet.
전화 : 00798 14 800 6332
팩스 : +1 770 250 6199


