













공식 공급 업체
200 이상의 소프트웨어 개발처와 판매 계약을 맺은 공인 디스트리뷰터로서 합법적인 라이선스를 제공합니다.
모든 브랜드 보기.

PDF bookmark navigation allows documents to include a structured list of bookmarks that link directly to specific chapters, sections, or pages, making it easier for users to move through content without extensive scrolling or searching. This improves navigation, saves time, and enhances the overall reading experience, particularly for large or information-rich documents. Common use cases include technical documentation, user manuals, contracts, reports, eBooks, training materials, and reference guides where users need quick access to specific topics or frequently referenced sections.
Several .NET WPF PDF components offer bookmark navigation including:
For an in-depth analysis of features and price, visit our comparison of .NET WPF PDF components.
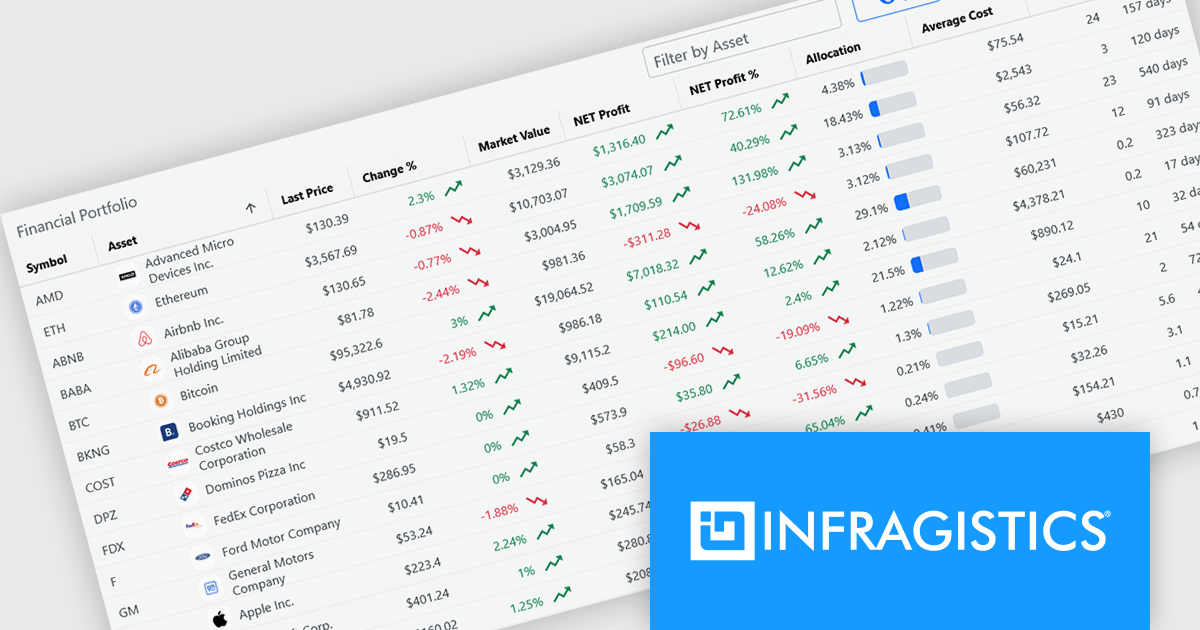
Infragistics is a software company that develops user interface (UI) components, design tools and productivity solutions for software developers. Its products support a range of application platforms, including .NET, JavaScript and web technologies, helping development teams build business applications with advanced data visualization, grids, charts, reporting and user experience capabilities. In addition to developer tools, the company offers low-code application development, embedded analytics and collaborative design solutions for organizations of all sizes.
Effective July 1, Infragistics has discontinued new single-product licenses for Infragistics Ultimate UI for Windows Forms, Infragistics Ultimate UI for WPF, and Infragistics Ultimate UI for ASP.NET. Existing customers can continue to renew their subscriptions, but new licenses for these standalone products are no longer available.
Although new standalone subscriptions are no longer available, these products remain included as part of Infragistics Professional and Infragistics Ultimate. Customers can continue to access the same UI toolkits through these broader subscription offerings.
For more information, visit our Infragistics Ultimate and Infragistics Professional product pages.
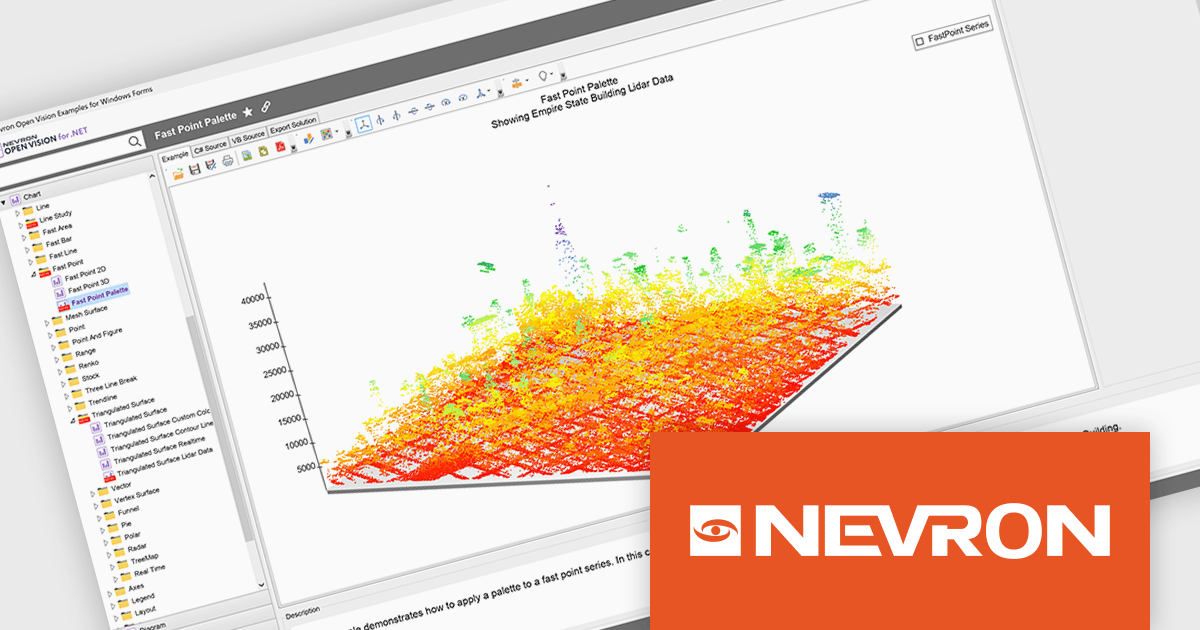
NOV Chart for .NET by Nevron is a comprehensive .NET charting component suite designed for cross-platform application development. It offers an array of 2D and 3D chart types, along with smart data labeling, an advanced chart axes model, numerous interactivity features and GPU-accelerated real-time rendering based on OpenGL. This library allows developers to seamlessly integrate rich, dynamic and interactive business, scientific, financial and presentation data visualizations into their .NET applications for more effective communication.
The NOV Chart for .NET 2026.1 update introduces a new Palette Fill Mode for Fast Area, Fast Bar, Fast Line, and Fast Point Series, giving developers greater control over how colors are applied across high performance charts. This enhancement makes it easier to create visually consistent and professionally styled data visualizations while reducing the effort required to maintain a unified appearance across multiple chart types. The added flexibility helps developers produce clearer dashboards, reporting interfaces, and analytics applications that better align with application branding and design requirements.
To see a full list of what's new in 2026.1, see our release notes.
NOV Chart for .NET is licensed per developer and is available as a perpetual license with 1 year support and maintenance. See our NOV Chart for .NET licensing page for full details.
NOV Chart for .NET is available in the following products:
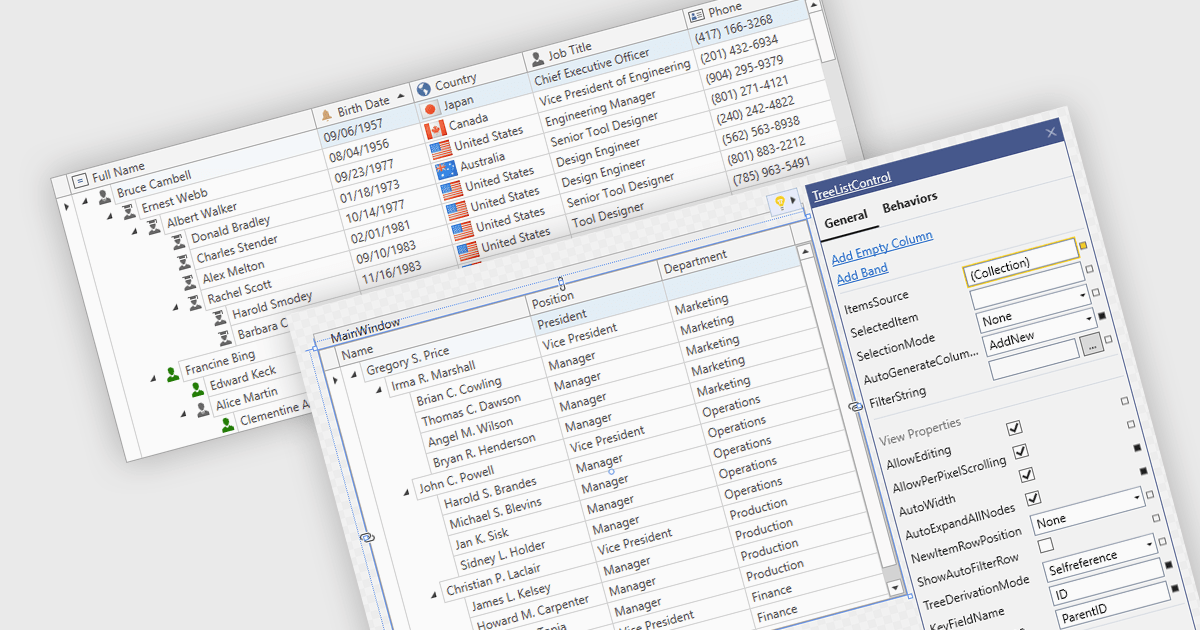
Treelist components present hierarchical data in a tabular format, combining the structure of a tree view with many of the capabilities commonly found in data grids. They allow users to expand and collapse parent-child relationships while viewing multiple data fields within the same interface. Treelists are commonly used to display organizational structures, project task hierarchies, file and folder systems, product categories, and other datasets that contain parent-child relationships. This approach helps organize complex datasets, improves navigation through large hierarchies, and can support tasks such as data viewing, editing, and management without requiring users to switch between different views.
Several WPF UI suites provide you with treelist functionality, including:
For an in-depth analysis of features and price, visit our comparison of WPF UI suites.
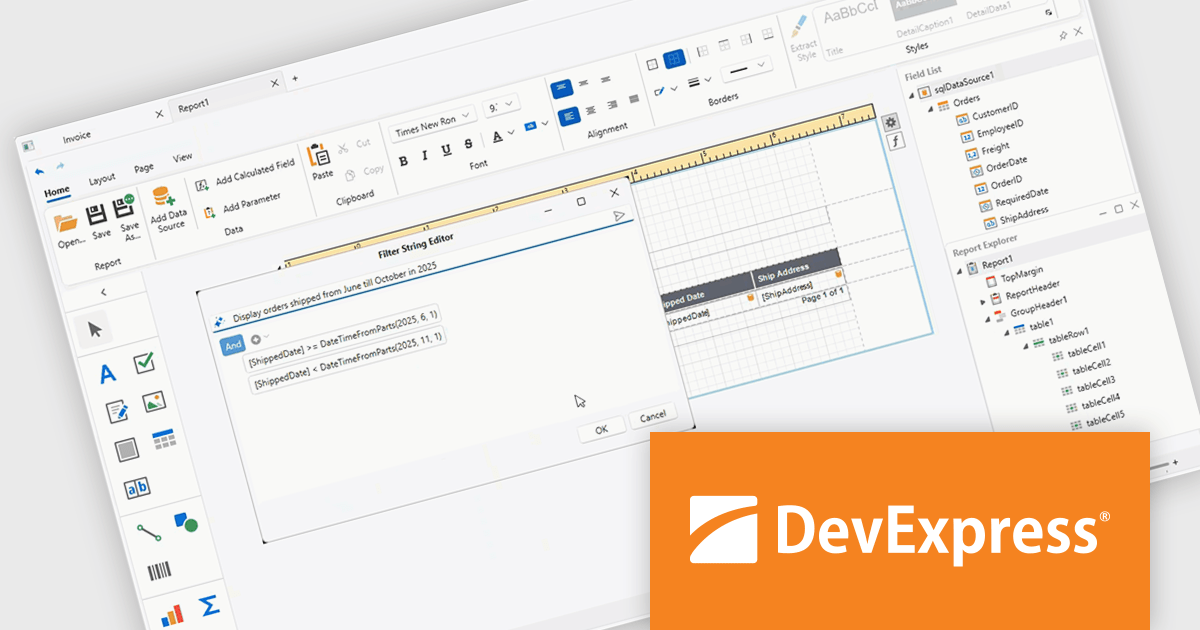
DevExpress Universal is a comprehensive suite of UI components and developer tools that supports the creation of feature-rich applications across web, desktop, and mobile platforms, including .NET, JavaScript, Blazor, ASP.NET, WinForms, WPF, and MAUI. It focuses on delivering consistent user interfaces, advanced data visualization, reporting, dashboards, and productivity features that help teams design, build, and maintain complex applications using a unified set of technologies and patterns.
DevExpress Universal 26.1 improves the WPF Report Designer with AI-assisted expression generation within both the Expression Editor and Filter String Editor. Instead of manually writing complex Criteria Language expressions, users can simply describe the required business logic in natural language and have the expression generated automatically. This capability helps reduce the learning curve for advanced reporting features, accelerates report creation, and makes it easier for developers and business users alike to build filters, calculated fields, and other expression-based functionality with greater confidence and accuracy.
DevExpress Universal is licensed per developer and is available as a Perpetual License with a 12 month support and maintenance subscription. See our DevExpress Universal licensing page for full details.
For more information, visit our DevExpress Universal product page.
전화 : 00798 14 800 6332
팩스 : +1 770 250 6199


