


공식 공급 업체
200 이상의 소프트웨어 개발처와 판매 계약을 맺은 공인 디스트리뷰터로서 합법적인 라이선스를 제공합니다.
모든 브랜드 보기.
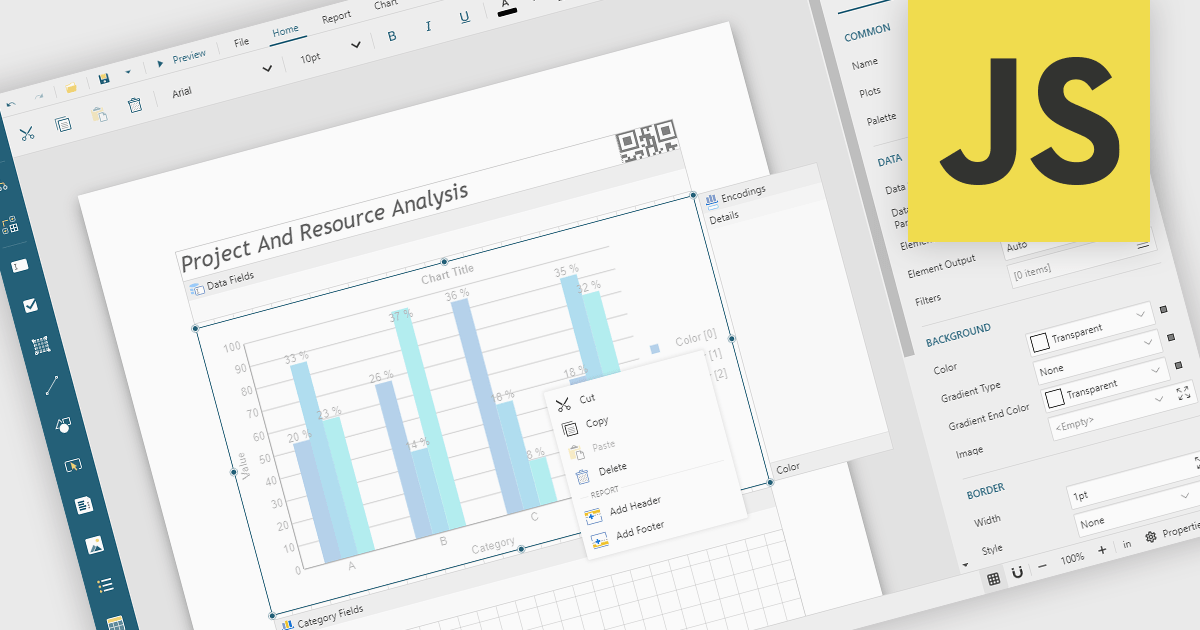
A Visual Report Designer is an application that enables users to create interactive, analytical, and print-ready reports using an intuitive, drag-and-drop interface. It supports fully customizable templates and data visualization components, helping teams present complex information clearly while maintaining consistent branding and layouts. Typical use cases include executive dashboards, financial and operational reports, customer analytics summaries, compliance documents, and branded client-facing reports.
Several JavaScript reporting components offer visual report designers including:
For an in-depth analysis of features and price, visit our JavaScript reporting comparison.
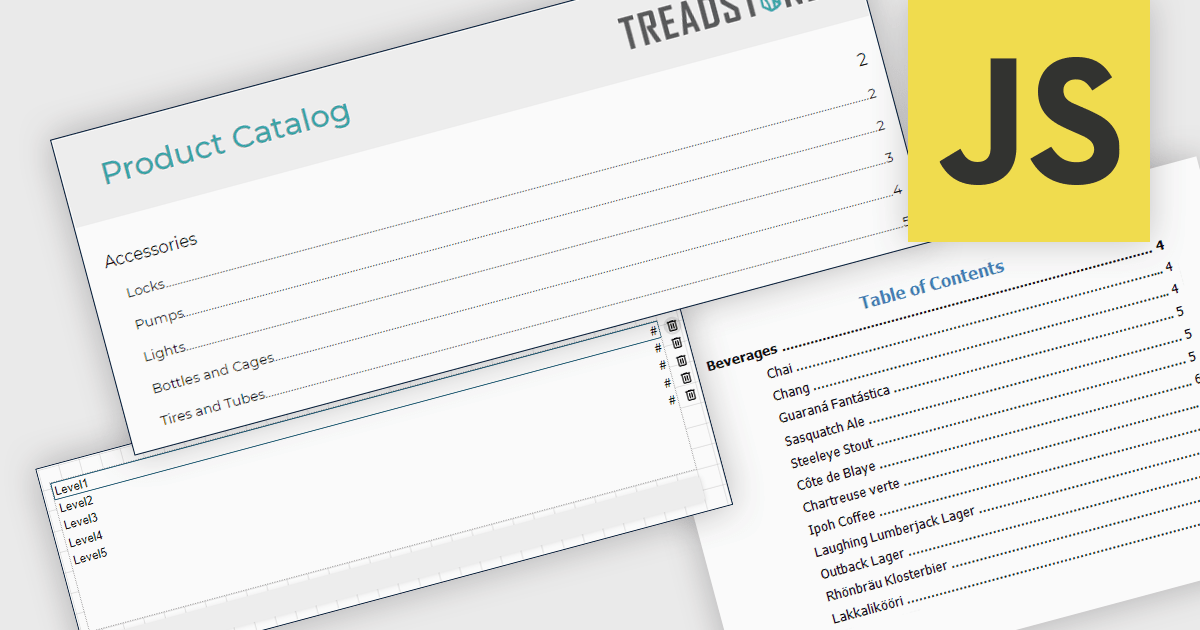
A table of contents in a report is a structured list of sections and subsections that provides an organized overview of the document's content. It typically reflects the report's hierarchy and allows readers to navigate quickly to specific sections, either through page references in printed formats or clickable links in digital formats. This functionality improves usability by reducing the time required to locate information, supporting clearer document structure, and making complex or lengthy reports easier to understand and manage. For organizations that distribute detailed analytical or operational reports, a table of contents contributes to a more professional presentation and a more efficient review process.
Several JavaScript reporting components allow you to add a table of contents, including:
For an in-depth analysis of features and price, visit our comparison of JavaScript reporting components.
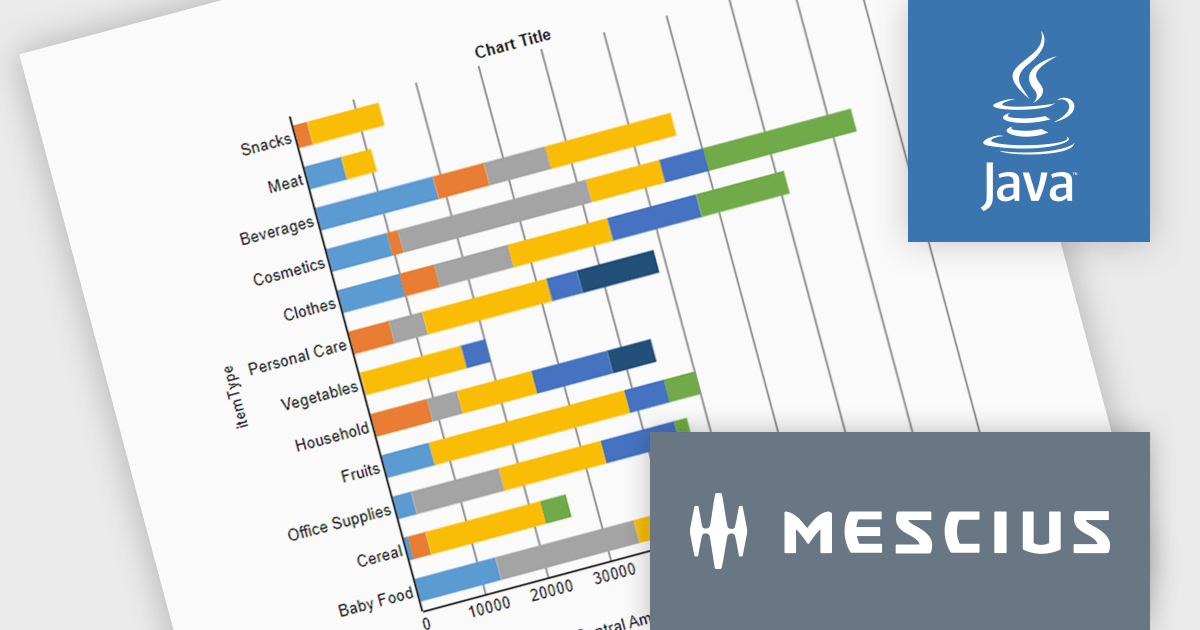
ActiveReportsJS is a powerful, lightweight reporting tool designed to integrate advanced reporting capabilities into any JavaScript application. ActiveReportsJS enables developers to create, view, export, and print richly formatted reports entirely on the client side - with zero server dependencies.
In this blog post, MESCIUS Product Engineer Sergey Abakumoff shows you how to integrate ActiveReportsJS, a 100% client-side JavaScript reporting tool with zero server dependencies, into a Java web application. Following his steps you will learn how to:
Detailed sample code is included to help you along.
Read the full blog to get started adding rich reporting capabilities to your Java web applications.
ActiveReportsJS is licensed on an annual subscription or perpetual basis and is available as a Single Deployment License for non-commercial use, and as a Single Domain License or Unlimited Domain License for commercial and/or SaaS use. See our ActiveReportsJS licensing page for full details.
For more information, visit our ActiveReportsJS product page.
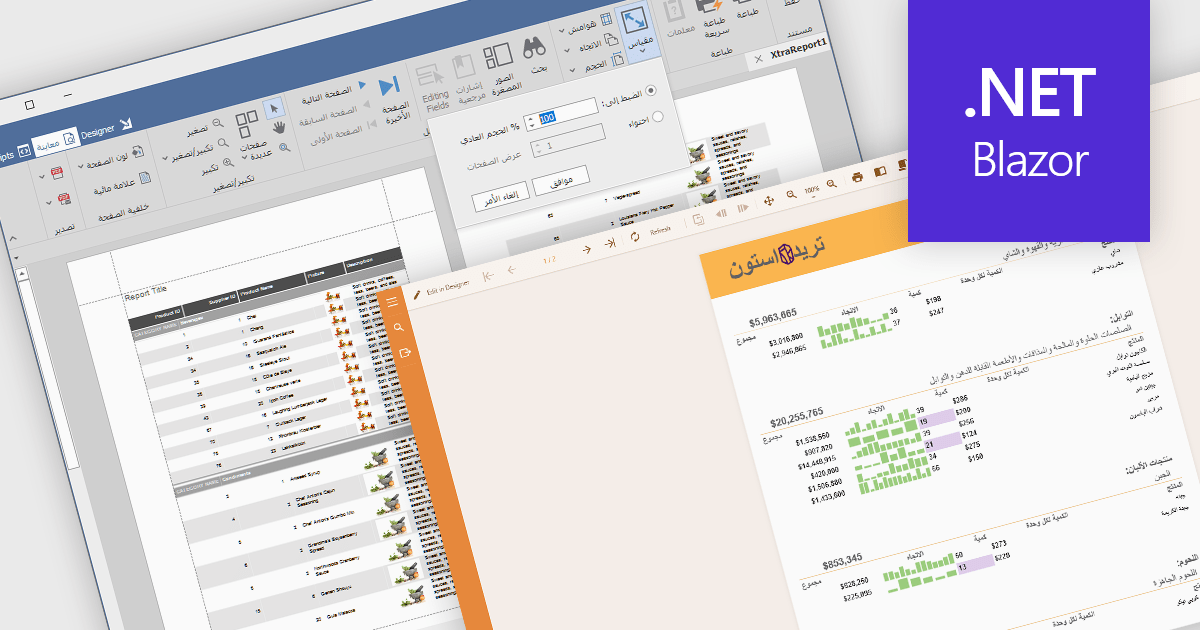
Right to left (RTL) support in reporting components enables reports to correctly display languages such as Arabic and Hebrew, where text flow, alignment, and layout follow a right-to-left reading order. This capability typically affects text rendering, page layout, table alignment, and user interface elements, helping reports remain readable and culturally appropriate without requiring separate report designs.
Several Blazor reporting controls offer right-to-left (RTL) support including:
For an in-depth analysis of features and price, visit our Blazor reporting controls comparison.
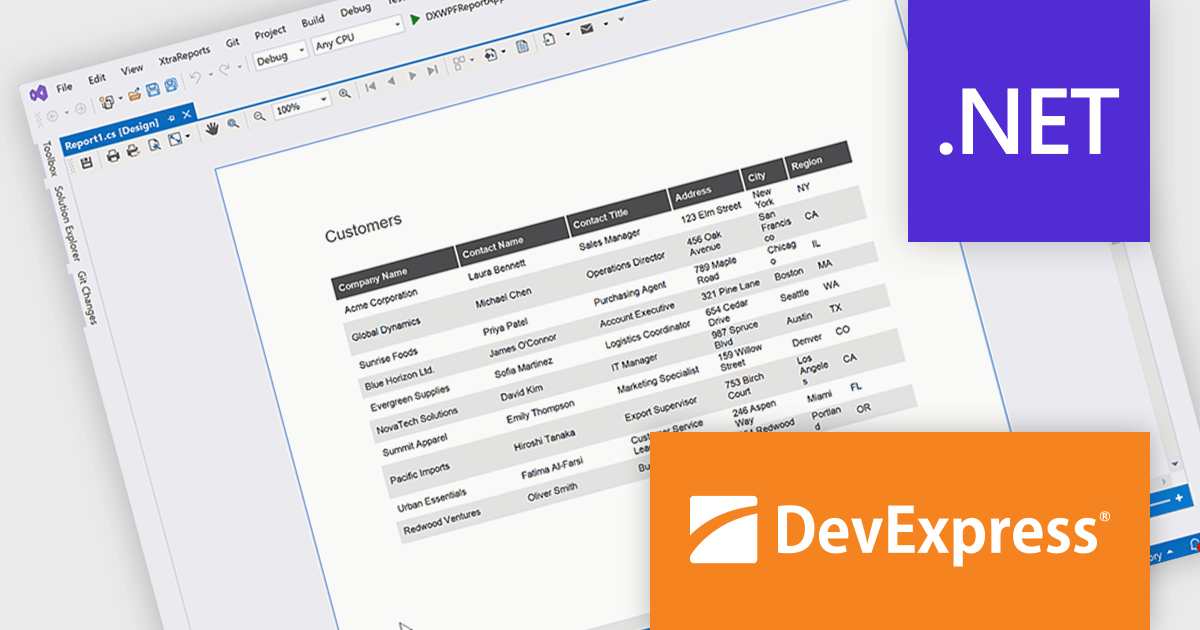
DevExpress Reporting is a comprehensive suite of reporting tools that empowers developers to create visually stunning and highly customizable reports for various applications. With its rich feature set, including data binding, layout design, printing, and exporting capabilities, DevExpress Reporting enables the efficient creation of reports that meet the most demanding business requirements.
The DevExpress Reporting 25.2 update allows developers to generate AI-generated test data to preview reports directly within the Visual Studio and End-User Report Designers for WinForms and WPF. By removing the need to connect to a live data source during design, it supports faster iteration and easier layout validation. This is particularly valuable when production data is unavailable or when sharing report templates that must not include sensitive information.
To see a full list of what's new in version 25.2, see our release notes.
DevExpress Reporting is licensed per developer and is available as a Perpetual License with a 12 month support and maintenance subscription. See our DevExpress Reporting licensing page for full details.
DevExpress Reporting is available to buy in the following products:
전화 : 00798 14 800 6332
팩스 : +1 770 250 6199


