













공식 공급 업체
200 이상의 소프트웨어 개발처와 판매 계약을 맺은 공인 디스트리뷰터로서 합법적인 라이선스를 제공합니다.
모든 브랜드 보기.
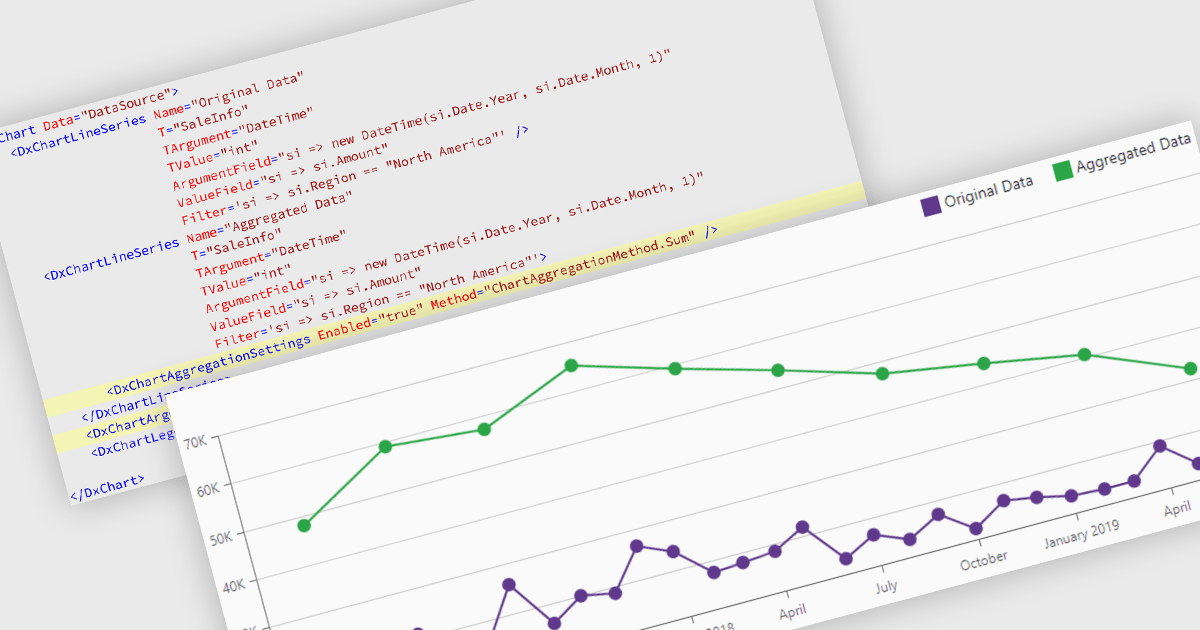
Data aggregation in chart components improves the readability and performance of data visualizations by combining multiple data points into larger, meaningful groups. This enables applications to present large or high-frequency datasets more effectively, reducing visual clutter while preserving overall trends and patterns. Aggregation can be applied dynamically based on the displayed range or selected interval, allowing users to explore data at different levels of detail without compromising responsiveness.
Several Blazor charting controls support data aggregation including:
For an in-depth analysis of features and price, visit our Blazor charting controls comparison.
DevExpress Blazor (part of DevExpress ASP.NET and Blazor) helps you create high-impact user experiences for both Blazor Server and Blazor WebAssembly using C#. The Blazor UI Component Library ships with a comprehensive set of native components including a Grid, Pivot Table, Scheduler, Chart, Data Editors and Reporting.
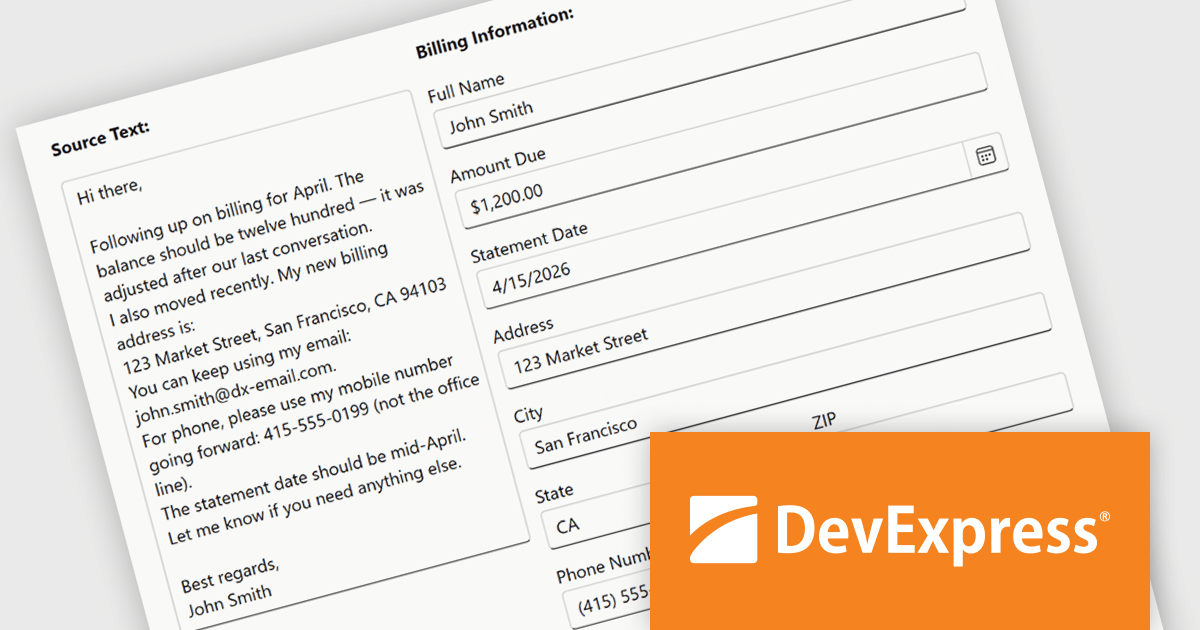
The DevExpress Blazor Form Layout component now includes Smart Paste, a new AI-powered capability designed to reduce manual data entry. Smart Paste can analyse unstructured content, such as email messages, support requests, or free-form notes, identify relevant information, and automatically populate matching form fields. This helps users transfer data into applications more quickly while reducing the risk of errors, making form-based workflows more efficient and easier to manage.
To see a full list of what's new in version 26.1, see our release notes.
DevExpress ASP.NET and Blazor is licensed per developer and is available as a Perpetual License with a 12 month support and maintenance subscription. See our DevExpress ASP.NET and Blazor licensing page for full details.
DevExpress Blazor is available in the following products:
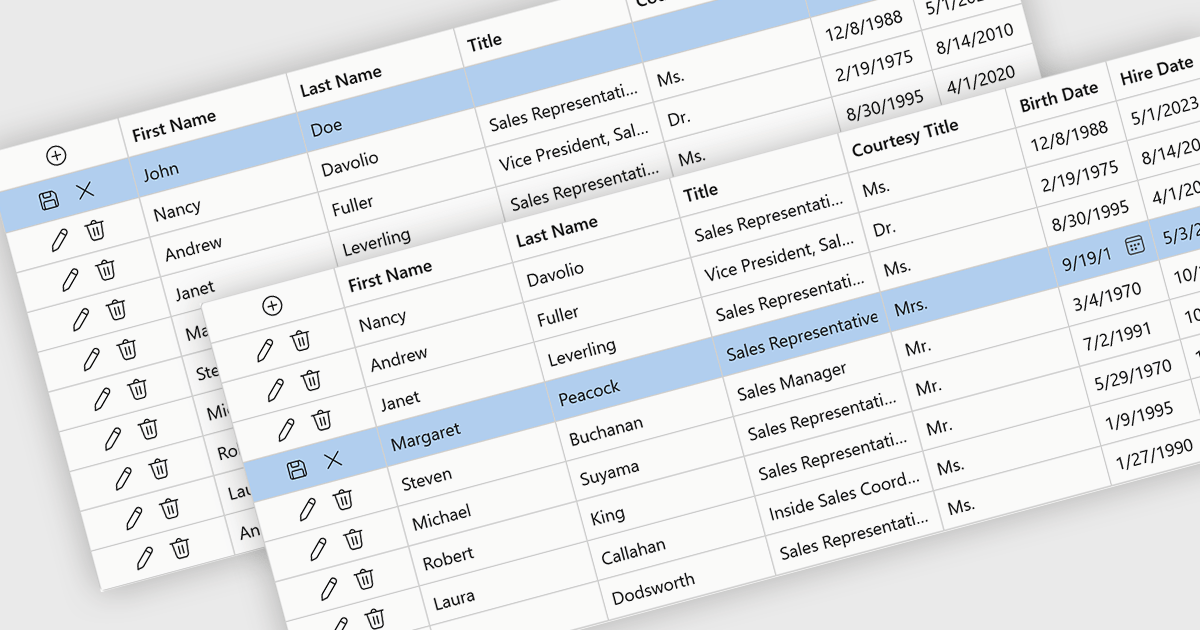
Row editing in grids allows users to update an entire record directly within a data grid, editing multiple fields at once without opening a separate form. This improves productivity by reducing clicks, keeping users in context, and making data updates faster and more intuitive. It also helps improve accuracy by allowing related information to be reviewed and validated together. Common use cases include managing customer records, updating inventory, processing orders, and maintaining employee or financial data in business applications.
Several .NET Blazor components provide data grids that allow row editing, including:
For an in-depth analysis of features and price, visit our comparison of .NET Blazor grid components.
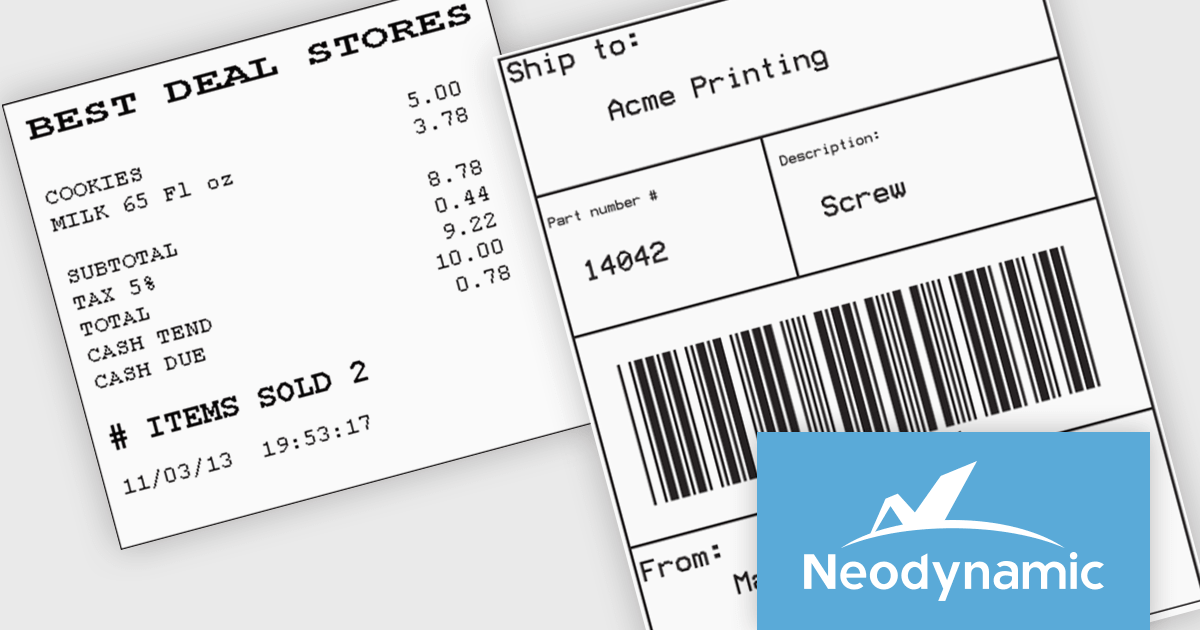
Neodynamic offers two JSPrintManager solutions for client-side printing and scanning in web applications. JSPrintManager for Any Web Platform allows you to integrate printing functionality into any website built with technologies like ASP.NET, PHP, or Blazor using pure JavaScript. Neodynamic also offers JSPrintManager for Blazor which enables you to seamlessly add printing capabilities to your Blazor server or WebAssembly projects with C# code. Both solutions empower you to print various data formats directly from the browser without requiring user interaction with print dialogs.
JSPrintManager is well suited to retail and shipping applications where fast, accurate printing is a critical part of daily operations. Developers can print receipts, invoices, packing slips and shipping labels directly to compatible printers using native command languages, helping to ensure consistent output and optimal performance. Support for carrier-generated labels from UPS, FedEx, USPS and DHL makes it easy to integrate fulfillment and logistics workflows, while compatibility with a wide range of receipt and label printers provides the flexibility needed for point-of-sale, warehouse and distribution environments.
Neodynamic JSPrintManager is licensed per Web App and Web server and is available as a Perpetual license which includes 1 year of free updates and priority support. See our Neodynamic JSPrintManager for Any Web Platform and Neodynamic JSPrintManager for Blazor licensing pages for full details.
Learn more on our Neodynamic JSPrintManager for Any Web Platform and Neodynamic JSPrintManager for Blazor product pages.
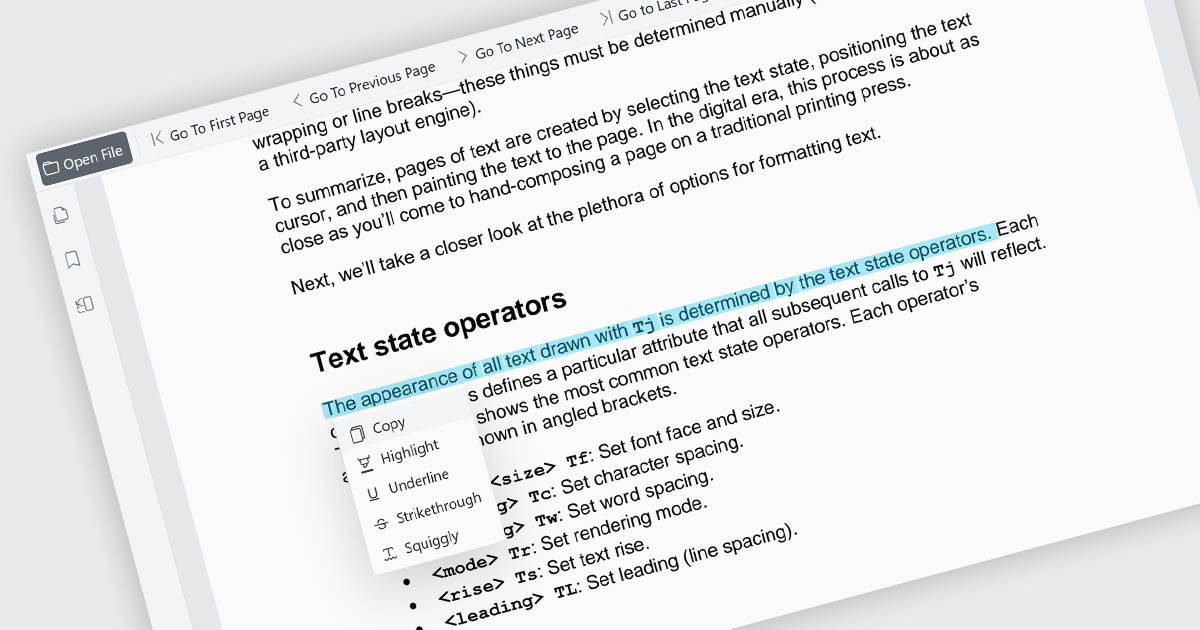
The ability to select and copy text directly within a PDF viewer allows users to highlight content and transfer it to other applications without leaving the document. This functionality enables the efficient extraction of information from PDF files, reducing the need to manually retype content and helping to minimize errors. It supports a wide range of use cases, including research, document review, content reuse, and collaboration across teams. This capability improves productivity by making it easier to reuse information, extract key details, support research activities, and incorporate content into reports, emails, presentations, or other business documents while maintaining an efficient reading experience. It also enhances accessibility and usability by allowing users to interact with document content in a more flexible and practical manner.
Several Blazor PDF viewer components allow you to select and copy text, including:
For an in-depth analysis of features and price, visit our comparison of Blazor PDF viewer components.
전화 : 00798 14 800 6332
팩스 : +1 770 250 6199


