


공식 공급 업체
200 이상의 소프트웨어 개발처와 판매 계약을 맺은 공인 디스트리뷰터로서 합법적인 라이선스를 제공합니다.
모든 브랜드 보기.
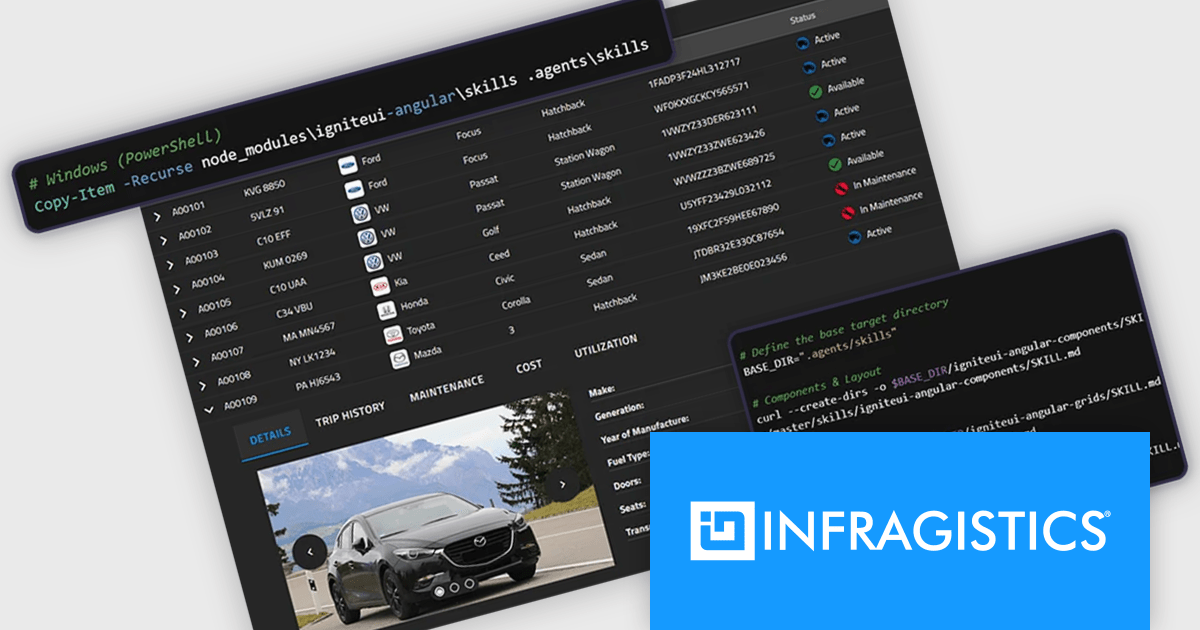
Infragistics Ultimate is a comprehensive development toolkit designed to improve the creation of high-performance, visually rich applications across multiple platforms. It includes a wide range of user interface (UI) components and development tools for web, desktop, and mobile applications, supporting frameworks such as Angular, React, Blazor, .NET, and more.
The Infragistics Ultimate 26.1 release includes an AI-Assisted Development Toolchain which helps ensure AI coding assistants generate applications using the correct Ignite UI components, APIs, import paths, and design tokens, reducing the risk of inaccurate code suggestions. Designed to keep AI-generated development aligned with established design systems and component libraries, the toolchain is available as three independently usable layers. All three layers now support Angular, React, Web Components, and Blazor, giving development teams greater flexibility when incorporating AI-assisted workflows into modern application projects.
To see a full list of what's new in version 26.1, see our release notes.
Infragistics Ultimate is licensed per developer and is available as a Perpetual License with a 1, 2 or 3 year support and maintenance subscription. See our Infragistics Ultimate licensing page for full details.
For more information, visit our Infragistics Ultimate product page.
FastReport .NET Ultimate is a comprehensive reporting solution for developers working within the Microsoft .NET ecosystem. It supports the creation, design, and delivery of rich, interactive reports across Windows Forms, ASP.NET, MVC, and .NET Core applications. The Ultimate edition includes server deployment capabilities and extensive export options, such as PDF, Excel, Word, and HTML. It connects to various data sources, including SQL databases and business objects, providing flexibility for enterprise-level reporting. With the integrated FastReport Online Designer, users can edit reports directly in their browsers, enabling efficient collaboration and modern, full-featured report design across both desktop and web platforms.
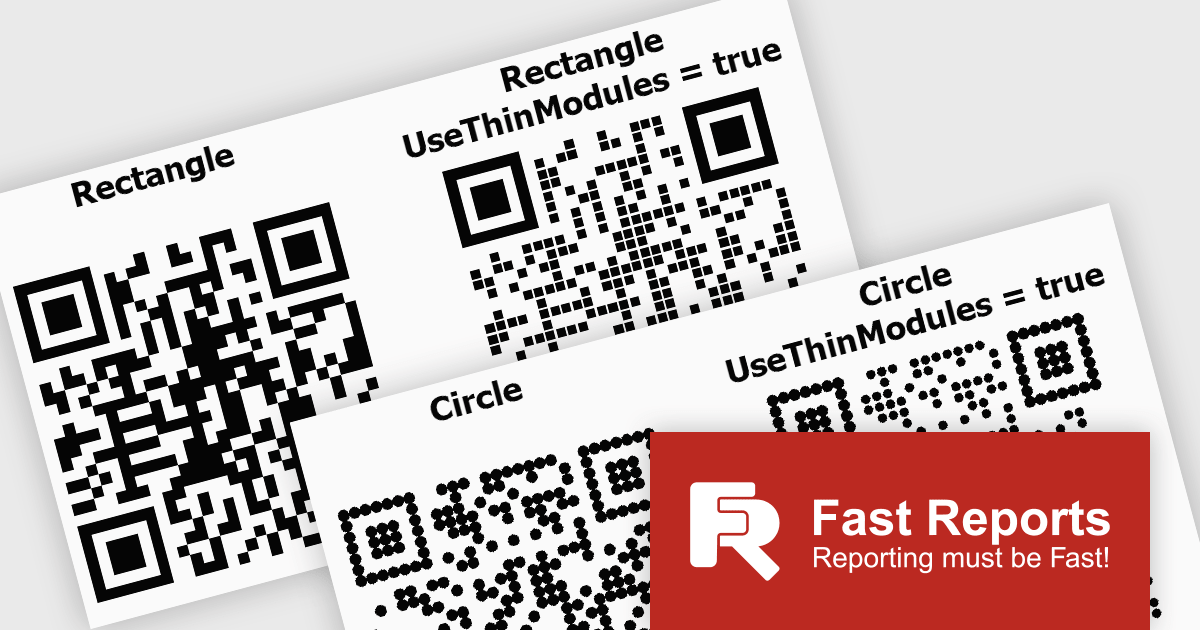
FastReport .NET Ultimate offers developers flexibility when generating QR codes, making it easier to adapt their appearance to different applications, reports, and branding requirements. By supporting a wider range of visual styles directly within the reporting engine, it enables teams to create QR codes that integrate more naturally into user interfaces, printed documents, dashboards, and customer facing materials. This helps produce more polished and professional output while maintaining compatibility, readability, and reliable scanning across standard QR code readers and devices.
FastReport .NET Ultimate is licensed per named user and is available as a perpetual license with a one-year subscription for updates and support. See our FastReport .NET Ultimate licensing page for full details.
For more information, visit our FastReport .NET Ultimate product page.
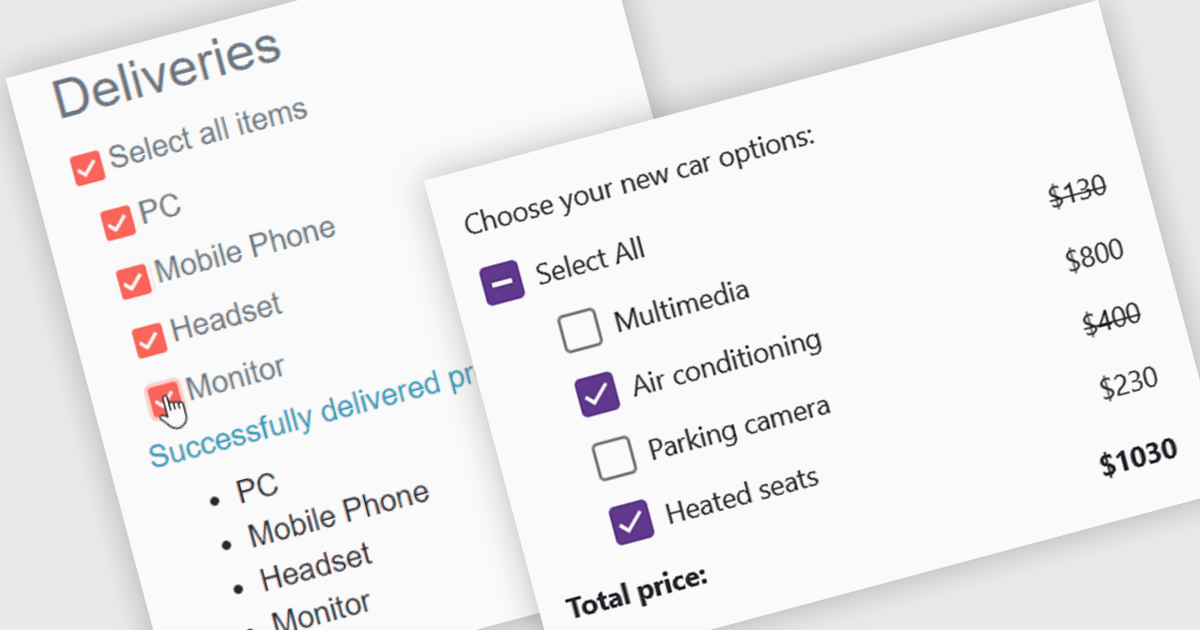
A checkbox data editor is a user interface element that enables users to view and modify Boolean values within forms, data grids, or other data-bound components. It provides an intuitive way to represent true/false, enabled/disabled, or selected/unselected states while maintaining synchronization between the user interface and the underlying data model. For developers, checkbox data editors simplify data entry and validation, improve usability by presenting state-based values in a familiar format, reduce input errors compared to manual text entry, and integrate with Blazor’s data binding and event-handling capabilities to support responsive, maintainable applications.
Several .NET Blazor data editor collections contain checkbox editors including:
For an in-depth analysis of features and price, visit our comparison of .NET Blazor data editors.
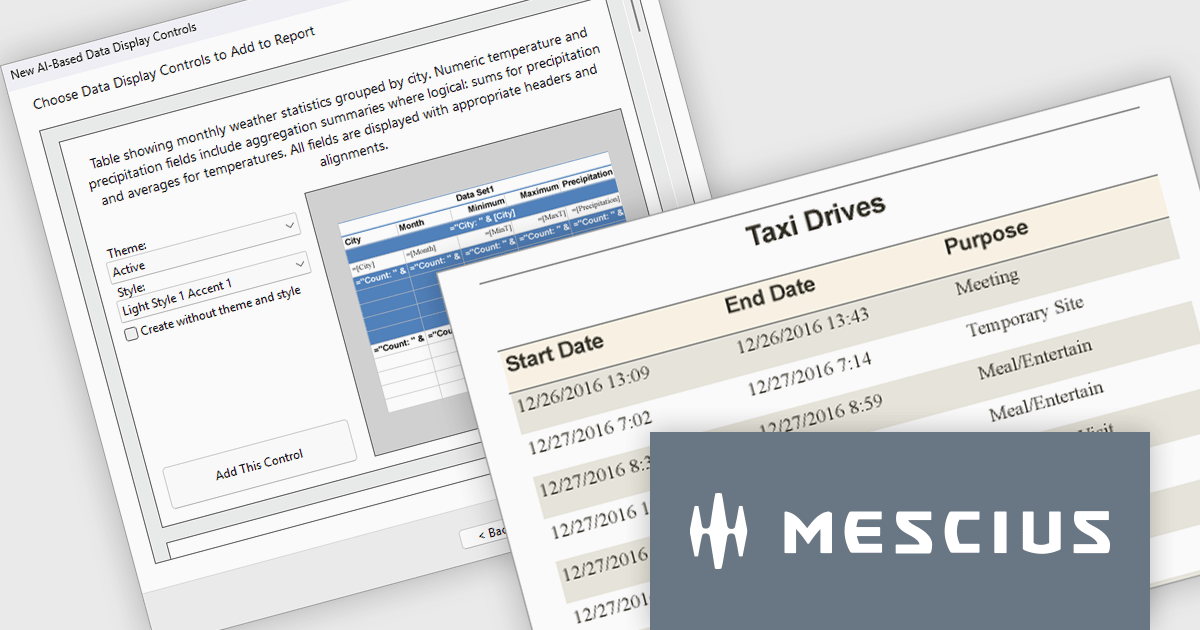
ActiveReports.NET by MESCIUS is a reporting solution for the Microsoft .NET platform that enables developers to create and deliver data-driven reports in web, desktop, and cloud applications. It supports multiple report types, including section, page, and RDL (Report Definition Language) reports, and provides visual designers, a robust rendering engine, and export options such as PDF and Excel. Designed to integrate with modern .NET and ASP.NET Core applications, it helps teams build interactive, enterprise-grade reporting features into their software.
The ActiveReports.NET v20.1 update includes AI Driven Smart Data Regions, enabling developers to generate cleaner and more consistent report layouts automatically. By applying standardized date formatting, removing duplicate columns, and using structured grouped table layouts with appropriate headers, footers, and page breaks, it reduces the need for manual report refinement while improving readability and navigation. This enhancement helps development teams deliver professional quality reports more efficiently and ensures more consistent results from AI generated report designs.
To see a full list of what's new in v20.1, see our release notes.
ActiveReports.NET is licensed per developer. Dependent on geographic location it is available as either an Annual (Timed) Subscription License or as a Perpetual Developer License which comes with 1 year of software updates and support. Each developer requires a license to design, develop, or maintain applications. The Annual Subscription License must be renewed each year to continue to work with the software. Published applications are royalty free and do not expire. Optional pipeline licenses available for CI/CD build servers. See our ActiveReports.NET licensing page for full details.
Learn more on our ActiveReports.NET product page.
Blazorise is a versatile component library that empowers developers to build modern and feature-rich web applications using Blazor, a client-side web development framework from Microsoft. It offers a comprehensive collection of user interface components, including buttons, forms, charts, and navigation elements, all built with accessibility and responsiveness in mind.
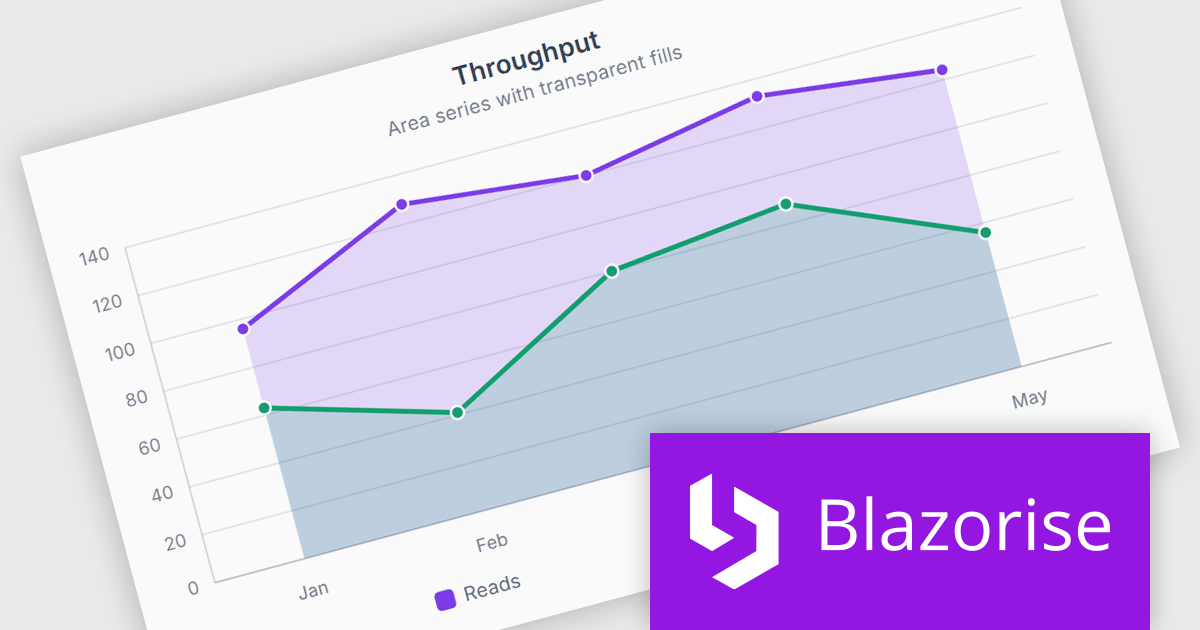
The Blazorise 2.2 update introduces SVG Charts, a native charting engine built with C# and Blazor that simplifies the development of dashboards, reports, and other data driven applications. By eliminating the need for external JavaScript charting libraries, it reduces development complexity and allows developers to create interactive visualizations using familiar Blazor patterns.
To see a full list of what’s new in version 2.2, see our release notes.
Blazorise is licensed per developer and includes a 1 year subscription for updates and support. Professional, Enterprise, and Enterprise Plus editions are available, each offering tailored levels of support and service to meet varying business needs. See our Blazorise licensing page for full details.
For more information, visit our Blazorise product page.
전화 : 00798 14 800 6332
팩스 : +1 770 250 6199


