













공식 공급 업체
200 이상의 소프트웨어 개발처와 판매 계약을 맺은 공인 디스트리뷰터로서 합법적인 라이선스를 제공합니다.
모든 브랜드 보기.
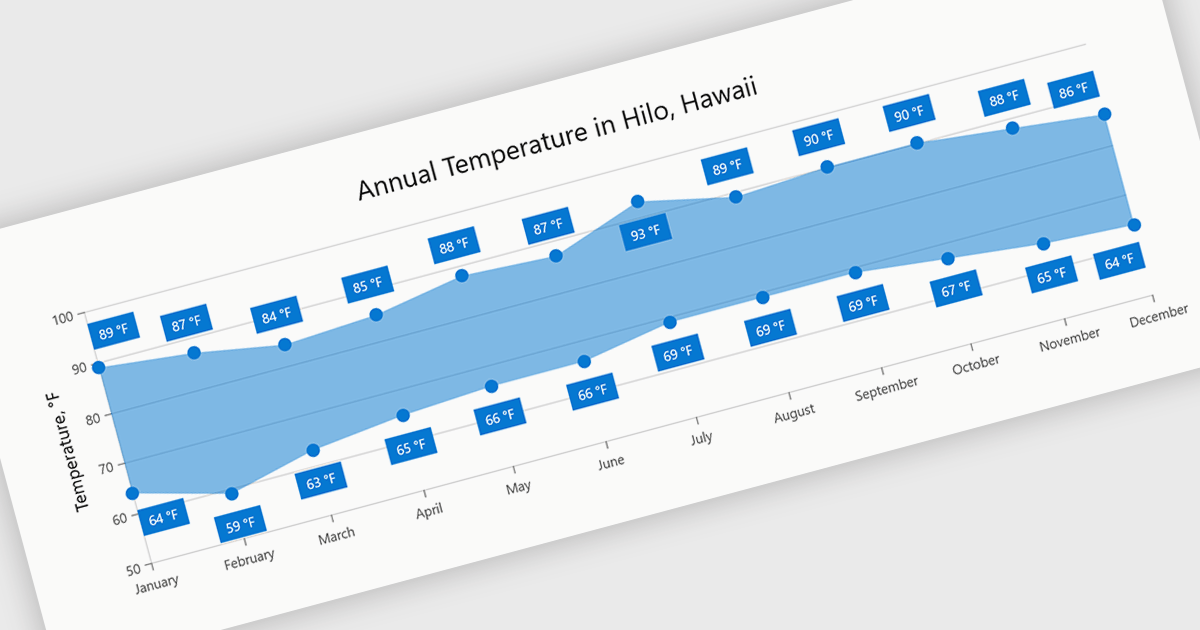
Range charts visualize the difference between minimum and maximum values for each data point using a filled area to represent variation. This makes it easier to understand fluctuations, compare ranges and identify patterns without the clutter of multiple lines. By focusing on value distribution rather than individual points, they improve readability and highlight trends and inconsistencies at a glance. They are useful for scenarios such as tracking temperature ranges, monitoring performance thresholds or comparing variations across datasets.
Several .NET Blazor charting components provide you with range charts, including:
For an in-depth analysis of features and price, visit our .NET Blazor chart controls comparison.
Blazorise is a versatile component library that empowers developers to build modern and feature-rich web applications using Blazor, a client-side web development framework from Microsoft. It offers a comprehensive collection of user interface components, including buttons, forms, charts, and navigation elements, all built with accessibility and responsiveness in mind.
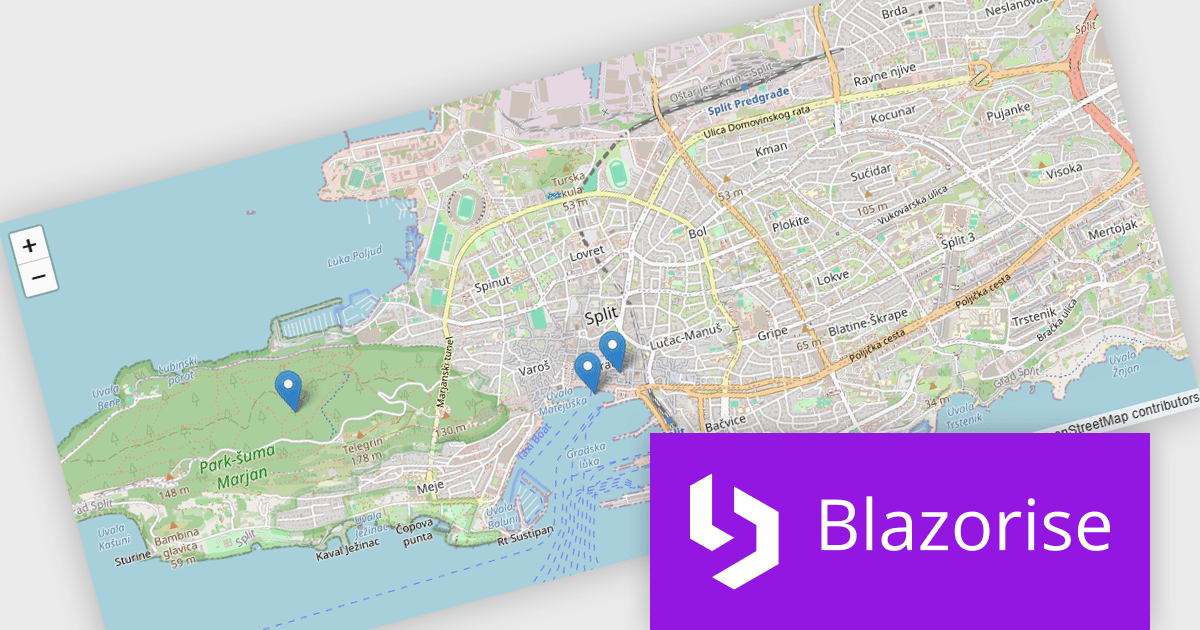
The Blazorise 2.1 update introduces a new maps component that enables developers to build interactive mapping functionality using a provider-neutral component model, allowing applications to remain independent of any specific mapping library. By abstracting core concepts such as maps, layers, markers, and shapes, developers can implement rich, data-driven map experiences with support for events, programmatic control, and synchronization between application state and the rendered map, while retaining the flexibility to adopt additional mapping providers in the future without requiring significant code changes.
To see a full list of what’s new in version 2.1, see our release notes.
Blazorise is licensed per developer and includes a 1 year subscription for updates and support. Professional, Enterprise, and Enterprise Plus editions are available, each offering tailored levels of support and service to meet varying business needs. See our Blazorise licensing page for full details.
For more information, visit our Blazorise product page.
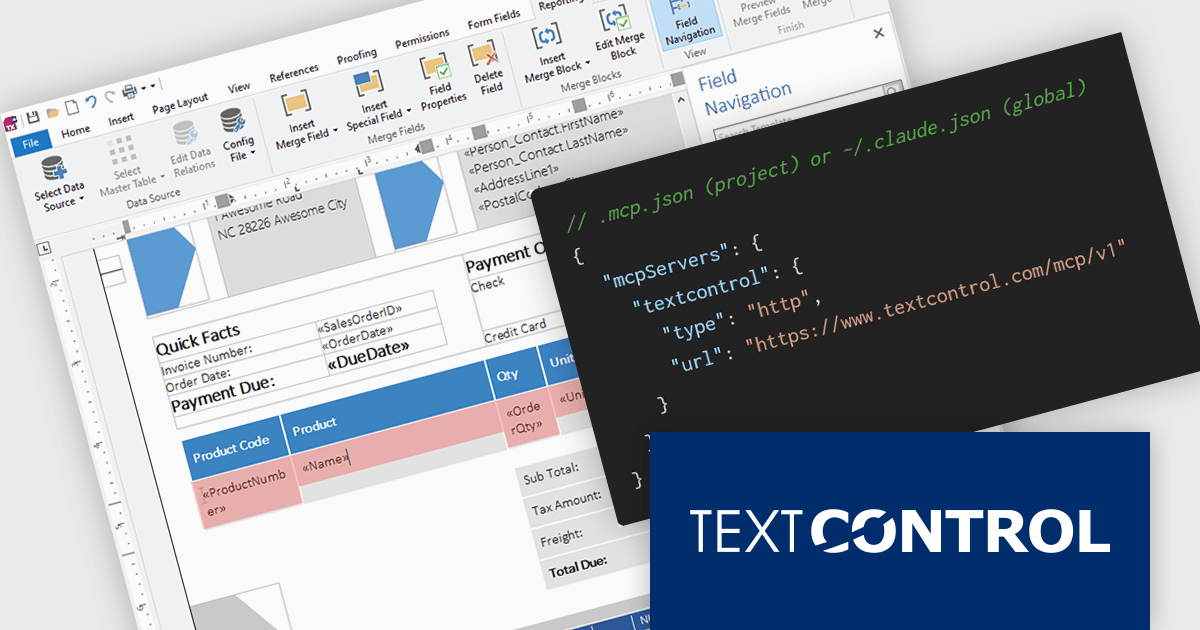
TX Text Control .NET is a royalty-free, fully programmable document editor that empowers developers to add rich WYSIWYG word processing to desktop and web applications across various platforms. It provides everything from comprehensive text formatting and mail merge to PDF creation and processing, all through a robust API and intuitive user interface.
The new Text Control MCP Server introduces a read-only Model Context Protocol (MCP) endpoint designed to integrate authoritative product knowledge into AI-assisted processes. By adding a single URL to an assistant’s configuration, developers can enable access to blog content, documentation, API references, and more, all without leaving the editor. This approach improves the relevance and accuracy of AI-generated responses, making it easier to work with up-to-date information across the entire Text Control ecosystem.
TX Text Control .NET for Windows Forms and TX Text Control .NET for WPF are licensed per developer and are available as a Perpetual License with a 12 month support and maintenance subscription. See our TX Text Control .NET for Windows Forms licensing page or TX Text Control .NET for WPF licensing page for full details.
TX Text Control .NET is available to buy in the following products:
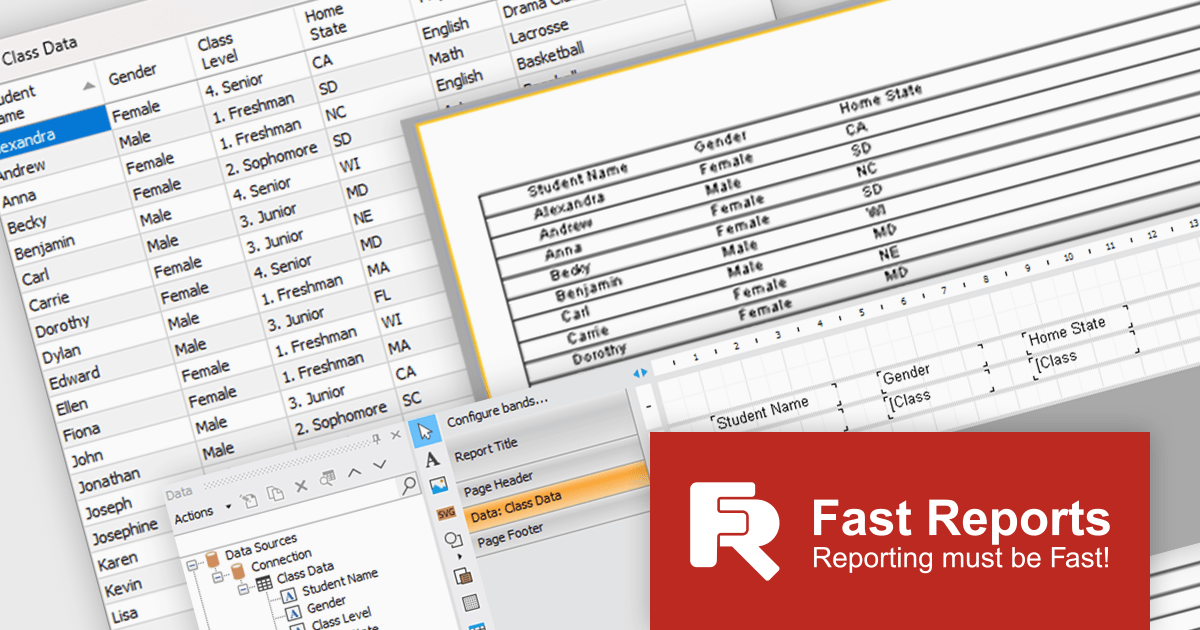
FastReport .NET Ultimate is a comprehensive reporting solution for developers working within the Microsoft .NET ecosystem. It supports the creation, design, and delivery of rich, interactive reports across Windows Forms, ASP.NET, MVC, and .NET Core applications. The Ultimate edition includes server deployment capabilities and extensive export options, such as PDF, Excel, Word, and HTML. It connects to various data sources, including SQL databases and business objects, providing flexibility for enterprise-level reporting. With the integrated FastReport Online Designer, users can edit reports directly in their browsers, enabling efficient collaboration and modern, full-featured report design across both desktop and web platforms.
The latest FastReport .NET Ultimate update introduces support for Google Sheets as a data source, allowing reports to connect directly to cloud-based spreadsheets. It enables developers and data professionals to work with up-to-date information without manual data transfers, making it easier to incorporate shared or frequently updated datasets into reports. It simplifies access to external data while maintaining the familiar reporting experience, making it particularly useful for teams already relying on Google Sheets for data management.
FastReport .NET Ultimate is licensed per named user and is available as a perpetual license with a one-year subscription for updates and support. See our FastReport .NET Ultimate licensing page for full details.
For more information, visit our FastReport .NET Ultimate product page.
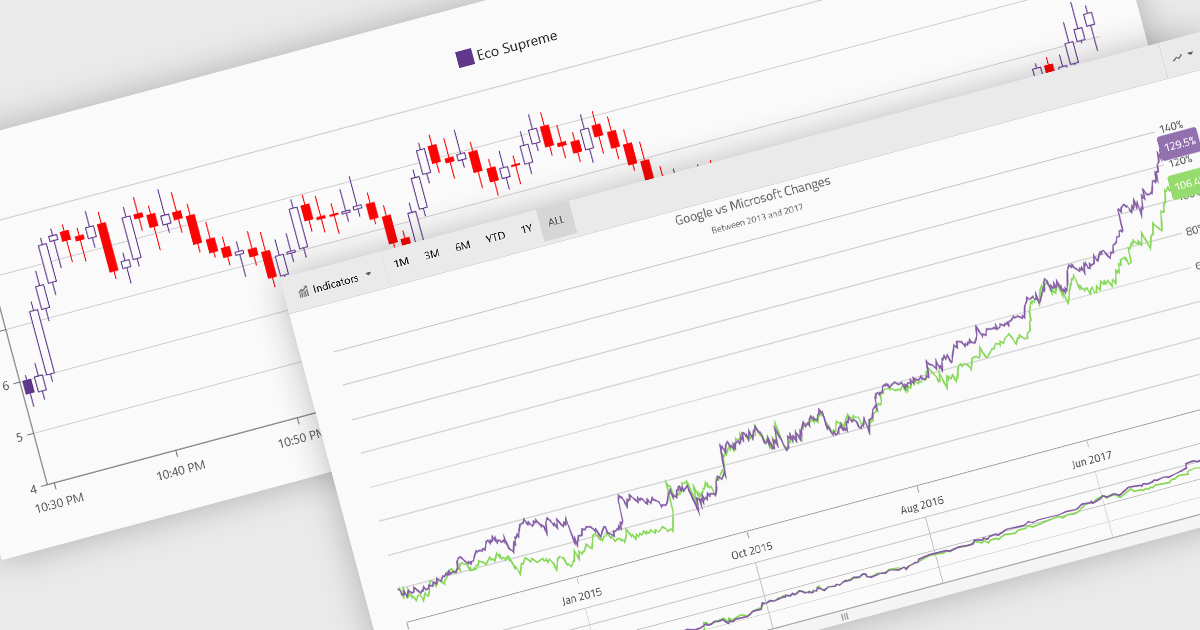
Financial charts are specialized visualizations designed to represent market data and price movements over time. Commonly used in trading platforms and analytical applications, these charts help users interpret open, high, low, and close values, as well as trends and volatility. By providing standardized financial visualizations, charting components enable developers to deliver tools that support technical analysis, decision-making, and real-time data exploration in finance-focused applications.
Common features include:
For an in-depth analysis of features and price, visit our Blazor charts components comparison.
전화 : 00798 14 800 6332
팩스 : +1 770 250 6199


