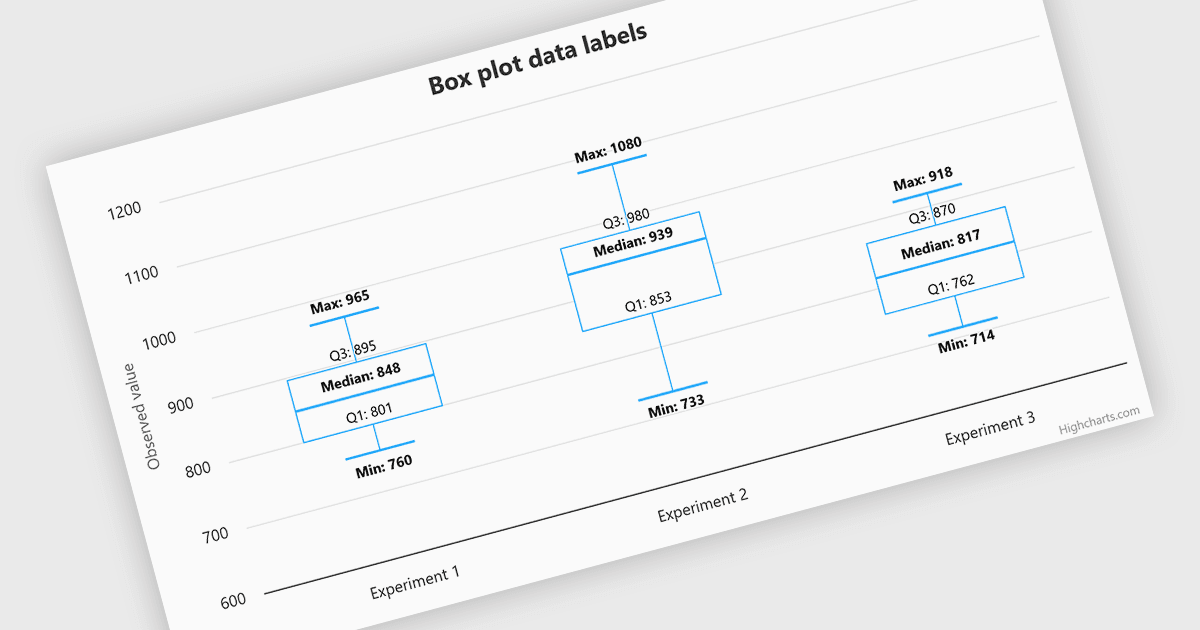
Align Data Labels with Key Statistical Values
Feature HighlightChart Controls
Highcharts v13 improves the readability of box plot charts by aligning data labels with minimum, maximum, median, and quartile values.
Feature-rich JavaScript libraries for charts, maps, stock, and Gantt data visualizations.

Prices from:
| Available individually | Our Price |
|---|---|
| Highcharts Suite | Loading |
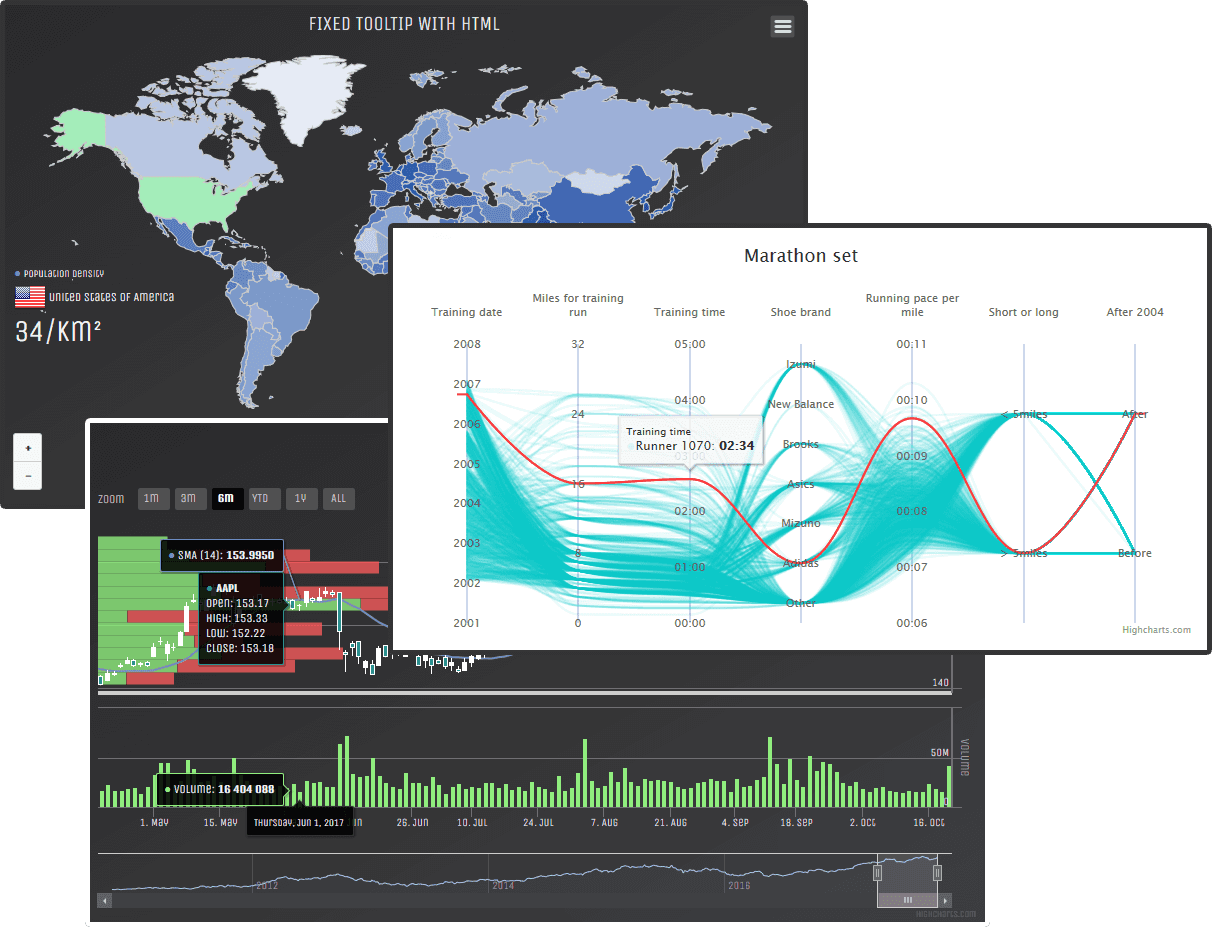
Includes data visualization libraries for charting, financial chart series, geographic maps, and Gantt-based timelines. This allows developers to work with different data types and visual models while using a consistent development approach.
Supports a wide range of chart types such as line, bar, pie, area, scatter, candlestick, map, and gantt charts. This enables applications to represent categorical, time series, spatial, and project-based data within a unified visualization ecosystem.
Provides specialized functionality for handling time-based datasets, including navigation controls, data grouping, and technical indicators. This supports use cases such as financial analysis, monitoring trends, and working with high-frequency data streams.
Enables rendering of interactive maps with support for region-based data binding, multiple layers, and drilldown navigation. Developers can visualize spatial datasets and combine them with other chart types for broader analytical context.
Includes Gantt chart functionality for representing tasks, dependencies, and schedules. This allows applications to display project timelines, track progress, and manage relationships between activities within structured visual timelines.
Delivers interactive features such as zooming, panning, tooltips, drilldown, and real-time updates across all included components. This ensures users can explore and interact with data directly within charts, maps, and timelines.
Uses a consistent API structure and configuration approach across all included libraries. This allows developers to reuse knowledge, apply similar patterns, and integrate multiple visualization types without switching between different programming models.
Handles large and complex datasets using optimized rendering and data processing techniques. This helps maintain responsiveness and usability when working with extensive time series, dense map data, or detailed project timelines.
Provides flexible styling through configuration and CSS, along with integration support for JavaScript, TypeScript, and frameworks such as Angular, React, Vue, and Svelte. This allows visualizations to align with application design systems and development environments.
Review the details below to ensure this product is supported within your environment.


Feature HighlightChart Controls
Highcharts v13 improves the readability of box plot charts by aligning data labels with minimum, maximum, median, and quartile values.
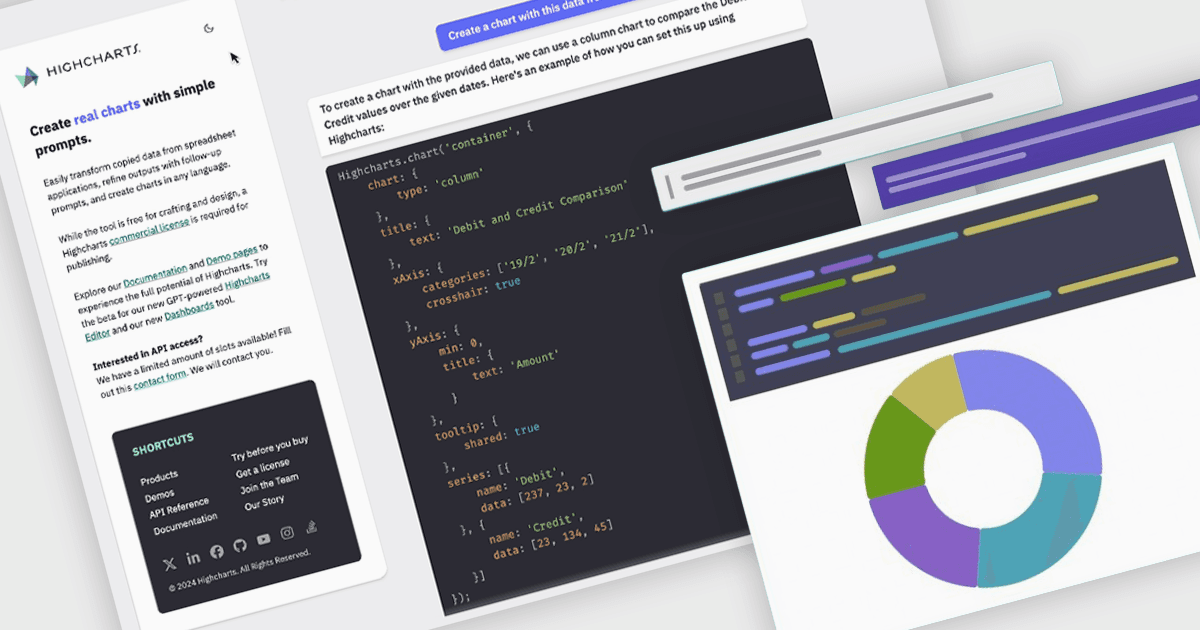
Highcharts GPT has been renamed Highcharts Assist to reflect a more flexible, future-ready assistant that goes beyond a single AI model.
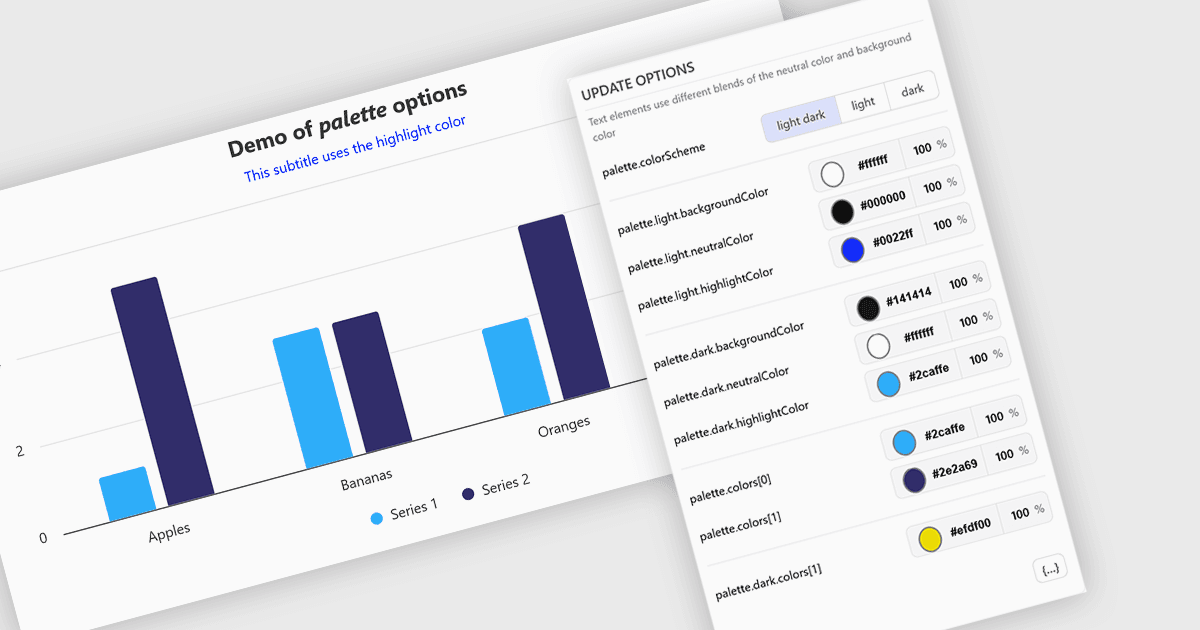
Highcharts v13 adds a centralized color palette system that simplifies branding, supports light and dark modes, and reduces maintenance.
Highsoft, established in 2006 and headquartered in Vik i Sogn, Norway, is renowned for its industry-leading JavaScript charting libraries, including Highcharts and its related products. Originating from a desire to create accessible, standards-based charting solutions, it has become a trusted name for developers and organizations requiring dynamic, cross-platform data visualizations. Highsoft’s libraries are compatible with a broad array of frameworks and programming languages, supporting use cases from simple dashboards to mission-critical applications. Its emphasis on accessibility, global support, and continuous quality improvement makes it a compelling choice for IT professionals seeking reliable visualization components.

As official and authorized distributors since 2017, ComponentSource supplies you with legitimate licenses directly from Highsoft.