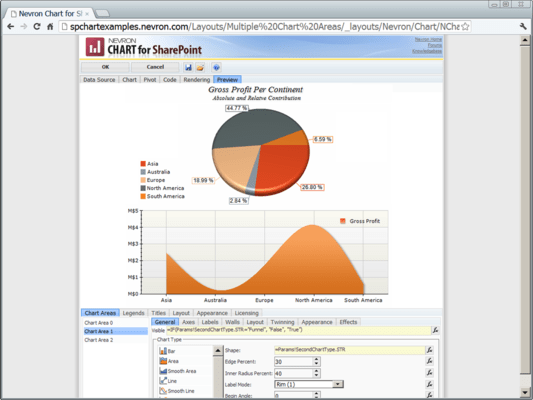
Nevron Chart for SharePoint
Ofereça soluções avançadas de gráficos para o ambiente do SharePoint.
Publicado por Nevron
Distribuído pela ComponentSource desde 1999
Preços a partir de: $ 1,557.22 Versão: 2022.1 Atualizado: Apr 6, 2022 ![]()
![]()
![]()
![]()
![]() (1)
(1)
Ofereça soluções avançadas de gráficos para o ambiente do SharePoint.
Publicado por Nevron
Distribuído pela ComponentSource desde 1999
Preços a partir de: $ 1,557.22 Versão: 2022.1 Atualizado: Apr 6, 2022 ![]()
![]()
![]()
![]()
![]() (1)
(1)

Released: Jun 11, 2014
Como distribuidores oficiais e autorizados, nós fornecemos licenças legítimas diretamente de mais de 200 editores de software.
Ver todas as nossas marcas.
Mais de 1.400.000 de licenças entregues a desenvolvedores, administradores de sistemas, corporações, governo e revendedores mundialmente.
Leia mais sobre nós.
Tel: (888) 850 9911
Fax: +1 770 250 6199
