


Fornecedor oficial
Como distribuidores oficiais e autorizados, nós fornecemos licenças legítimas diretamente de mais de 200 editores de software.
Ver todas as nossas marcas.
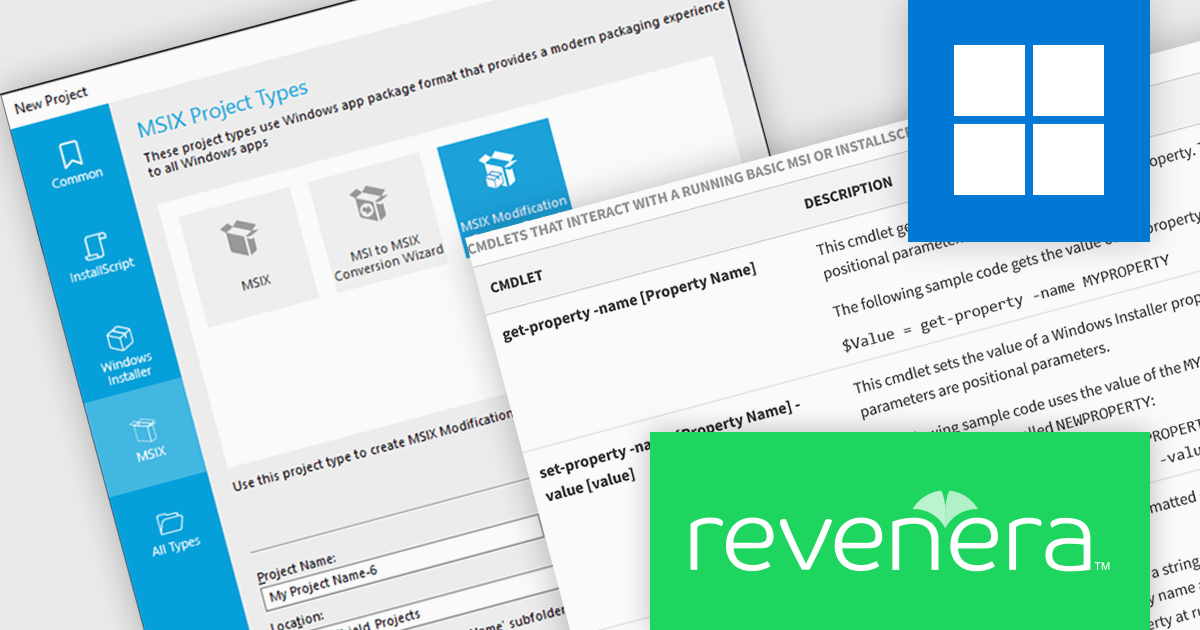
InstallShield by Revenera is a leading Windows installation development solution that specializes in building installers and managing software packages. InstallShield offers a streamlined interface and comprehensive features, enabling developers to efficiently create professional installers, configure prerequisites, manage updates, and customize the installation experience for diverse user needs.
The InstallShield 2026 R1 release adds support for running PowerShell scripts packaged within MSIX applications by using the Microsoft Package Support Framework (PSF). Through configurable custom fixups, developers can specify which executable a script applies to, whether it runs before application launch or after exit, and how it behaves during execution. This approach allows runtime configuration, compatibility adjustments, and cleanup tasks to be performed consistently within the MSIX container, reducing the need to modify the original application source code.
To see a full list of what's new in version 2026 R1, see our release notes.
InstallShield is licensed per user and is available as a 3 Year Timed Subscription. See our InstallShield Professional licensing page or InstallShield Premier licensing page for full details.
For more information, visit our InstallShield Professional or InstallShield Premier product pages.
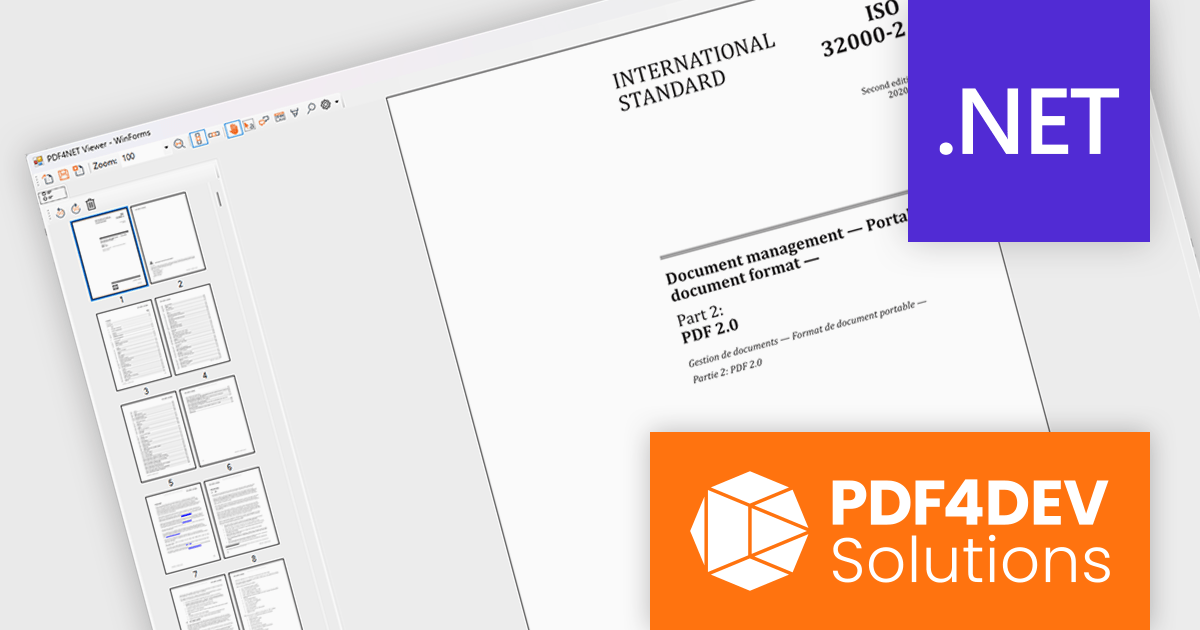
PDF4NET is a .NET library for generating, importing, and manipulating PDF documents on the fly from any .NET application. It does not rely on any Adobe products for creating or importing PDF files. PDF4NET hides the complex structure of PDF files behind a simple object model that allows creation of complex PDF files with a few lines of code.
PDF4NET now includes a PDF page thumbnails viewer control, providing a visual way to browse and navigate PDF documents. By displaying page previews in a dedicated panel, the control helps users move between pages more efficiently, especially in large or complex documents. It can be integrated into desktop applications to deliver a more familiar and user-friendly PDF viewing experience, making document exploration faster and more intuitive.
PDF4NET is licensed per developer. All licenses include a 12 month subscription which provides all major and minor product updates and technical support. See our PDF4NET licensing page for full details.
PDF4NET is available individually or as part of PDFBundle4NET.
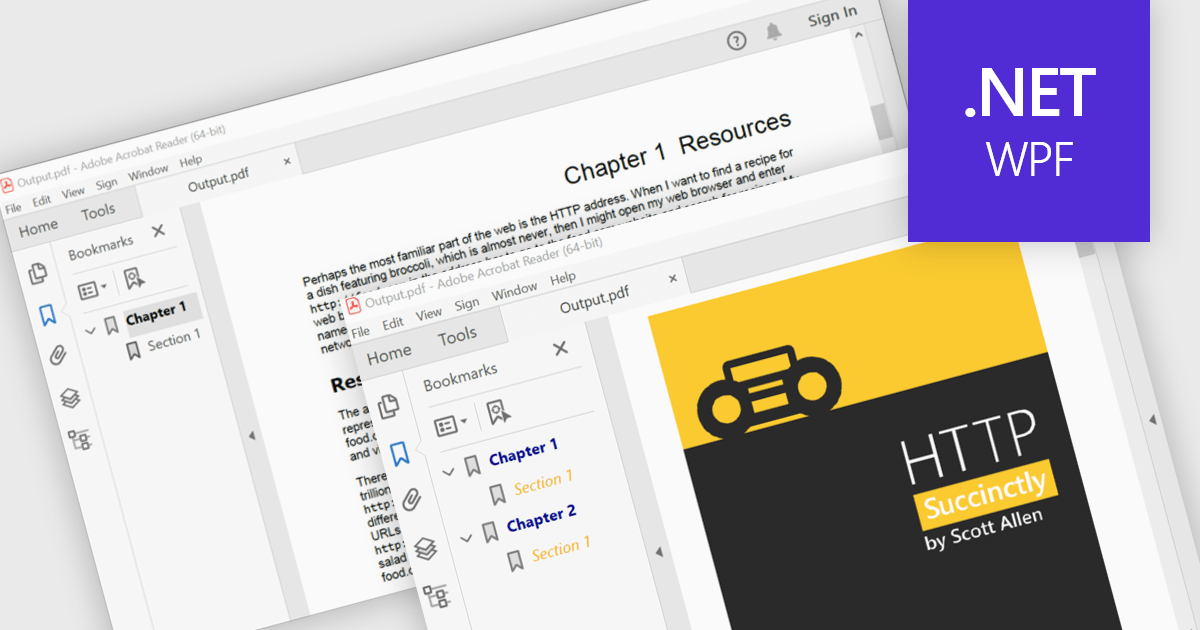
PDF bookmark navigation allows documents to include a structured list of bookmarks that link directly to specific chapters, sections, or pages, making it easier for users to move through content without extensive scrolling or searching. This improves navigation, saves time, and enhances the overall reading experience, particularly for large or information-rich documents. Common use cases include technical documentation, user manuals, contracts, reports, eBooks, training materials, and reference guides where users need quick access to specific topics or frequently referenced sections.
Several .NET WPF PDF components offer bookmark navigation including:
For an in-depth analysis of features and price, visit our comparison of .NET WPF PDF components.
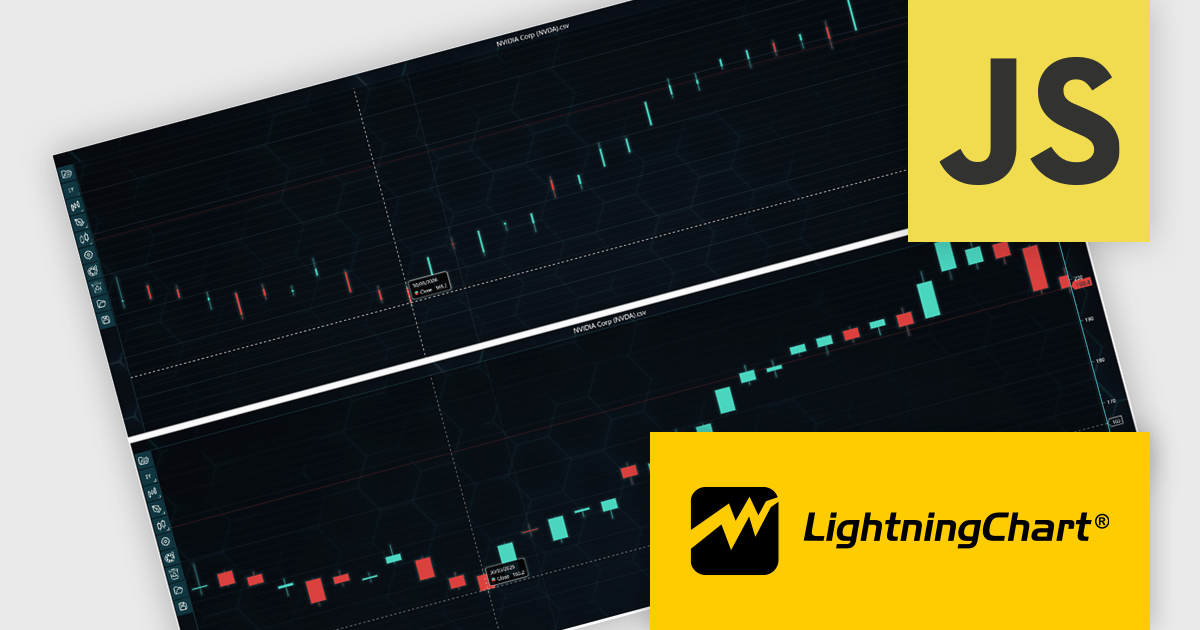
LightningChart JS Trader is a JavaScript/TypeScript library developed by LightningChart that specifically targets the creation of financial and trading applications. It provides high-performance, 2D, 3D, and real-time charting controls and a comprehensive suite of visualizations including candlestick, bar, line, and various technical indicators and drawing tools. This library enables software developers to create interactive technical analysis tools without the need for server-side setup as it runs completely on the client device.
LightningChart JS Trader automatically adjusts the width of candlesticks and bars as users zoom, improving chart readability and making more effective use of available space. By reducing unnecessary gaps between data points, it provides a clearer view of price movements and trends at different zoom levels without requiring manual configuration. This helps developers deliver more intuitive financial charting experiences while retaining the option to disable the feature when fixed-width rendering is preferred.
LightningChart JS Trader is licensed per developer and is available as an annual license with 1 year support. See our LightningChart JS Trader licensing page for full details.
For more information, see our LightningChart JS Trader product page.
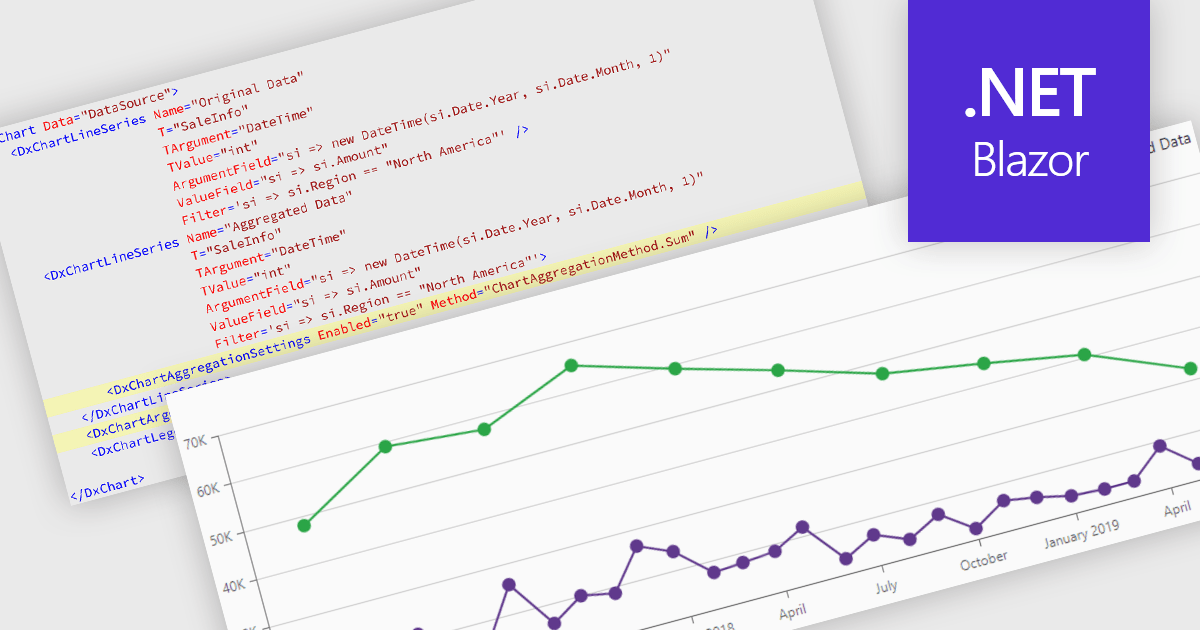
Data aggregation in chart components improves the readability and performance of data visualizations by combining multiple data points into larger, meaningful groups. This enables applications to present large or high-frequency datasets more effectively, reducing visual clutter while preserving overall trends and patterns. Aggregation can be applied dynamically based on the displayed range or selected interval, allowing users to explore data at different levels of detail without compromising responsiveness.
Several Blazor charting controls support data aggregation including:
For an in-depth analysis of features and price, visit our Blazor charting controls comparison.
Tel: (888) 850 9911
Fax: +1 770 250 6199


