













Fornecedor oficial
Como distribuidores oficiais e autorizados, nós fornecemos licenças legítimas diretamente de mais de 200 editores de software.
Ver todas as nossas marcas.
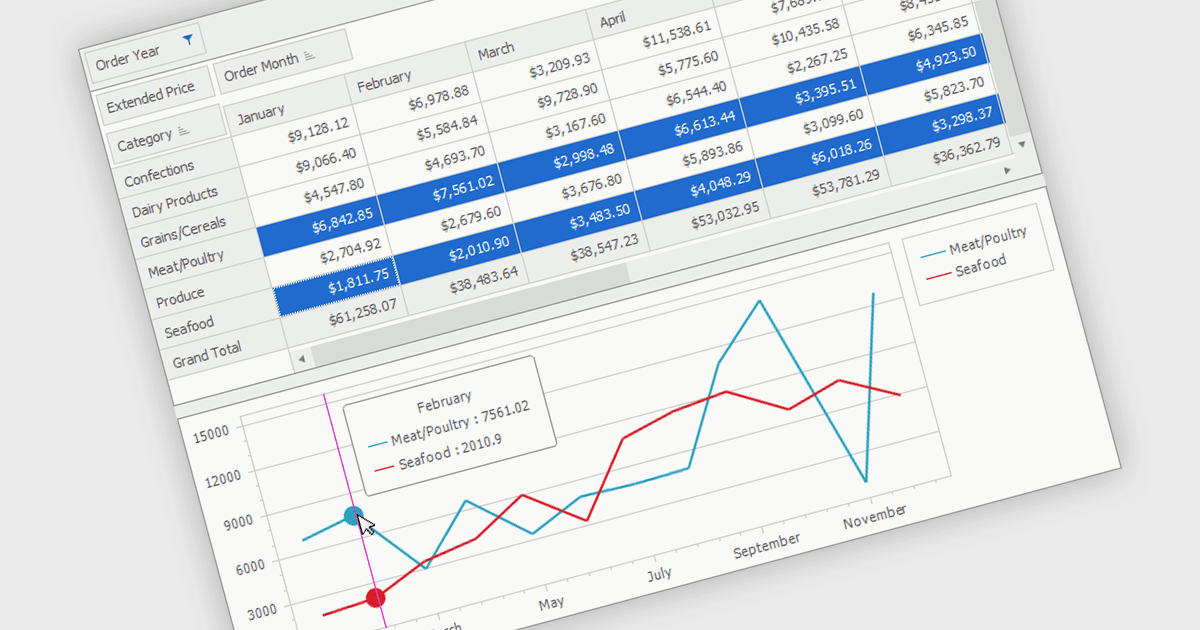
A pivot chart is an interactive data visualization tool that works alongside a pivot table to display summarized data in a graphical format. It enables users to analyze datasets by dynamically changing categories, series, and filters without altering the source data. By presenting trends, comparisons, and patterns visually, pivot charts make complex information easier to interpret and support faster decision making. They are widely used in business intelligence, reporting, and data analysis where flexible exploration of aggregated data is important.
Several .NET WinForms UI suites provide you with pivot chart functionality, including:
For an in-depth analysis of features and price, visit our comparison of .NET WinForms UI suites.
DevExpress WinForms is a comprehensive suite of 190+ UI controls and development tools designed for building high-performance desktop applications. It offers a broad array of customizable controls, from data grids and ribbon interfaces to advanced charts, maps, and diagramming components. This empowers developers to rapidly create functionally rich applications, while adhering to accessibility guidelines and touch-enabled technology for modern Windows environments.
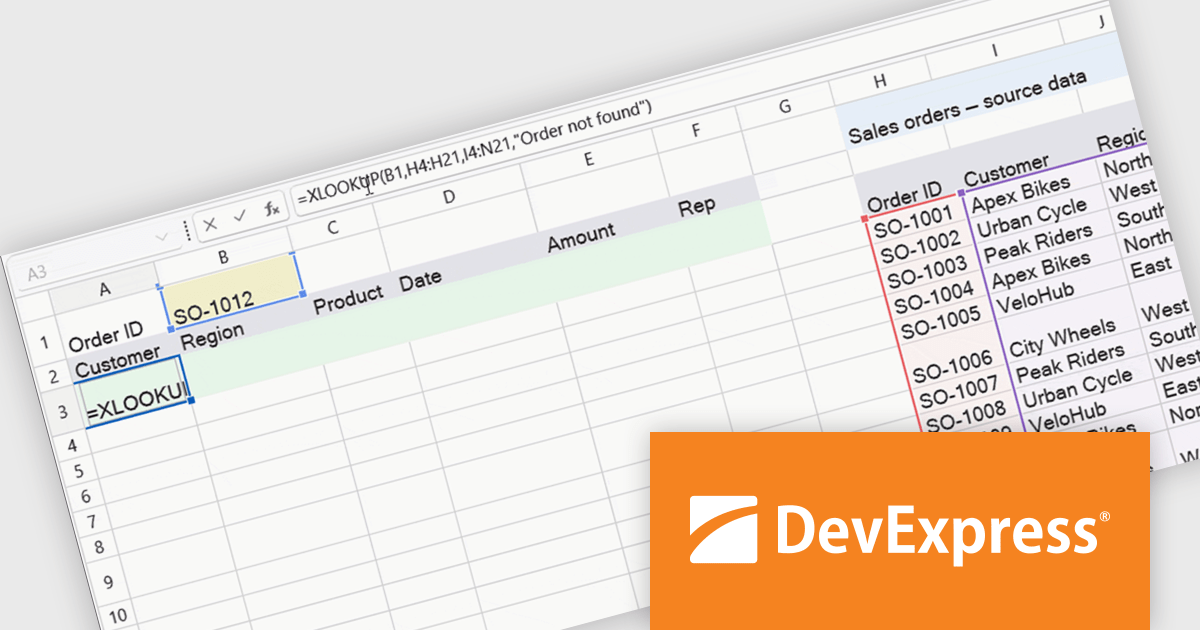
The WinForms Spreadsheet Control in version 26.1 adds support for six new dynamic array-based Microsoft Excel functions: XLOOKUP, XMATCH, SORT, SORTBY, FILTER, and UNIQUE. These additions make it easier to search, sort, filter, and organise spreadsheet data while reducing the need for complex formulas. By matching Microsoft Excel calculation behaviour more closely, the control also helps improve compatibility with existing workbooks and delivers a more familiar experience for users.
To see a full list of what's new in version 26.1, see our release notes.
DevExpress WinForms is licensed per developer and is available as a Perpetual License with a 12 month support and maintenance subscription. See our DevExpress WinForms licensing page for full details.
DevExpress WinForms is available individually or in the following products:
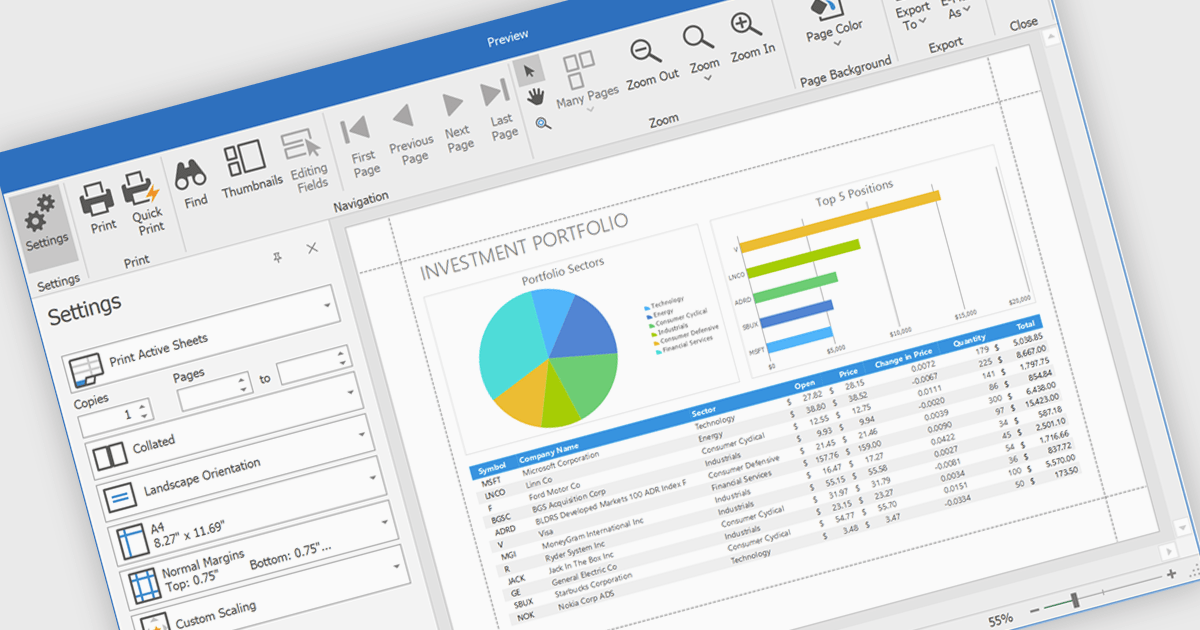
Printing spreadsheets enables users to produce high quality hard copies of worksheets while preserving formatting, tables, charts, images, and page layouts. Features such as print preview, page scaling, margins, and page break controls help ensure content fits correctly on the page, reducing the need for manual adjustments and improving readability. This makes spreadsheet printing valuable for business reports, financial statements, invoices, schedules, inventory lists, project plans, and other documents that need to be shared in meetings, distributed to stakeholders, archived for compliance, or reviewed offline.
Several .NET WinForms spreadsheet components enable printing, including:
For an in-depth analysis of features and price, visit our comparison of .NET WinForms spreadsheet components.
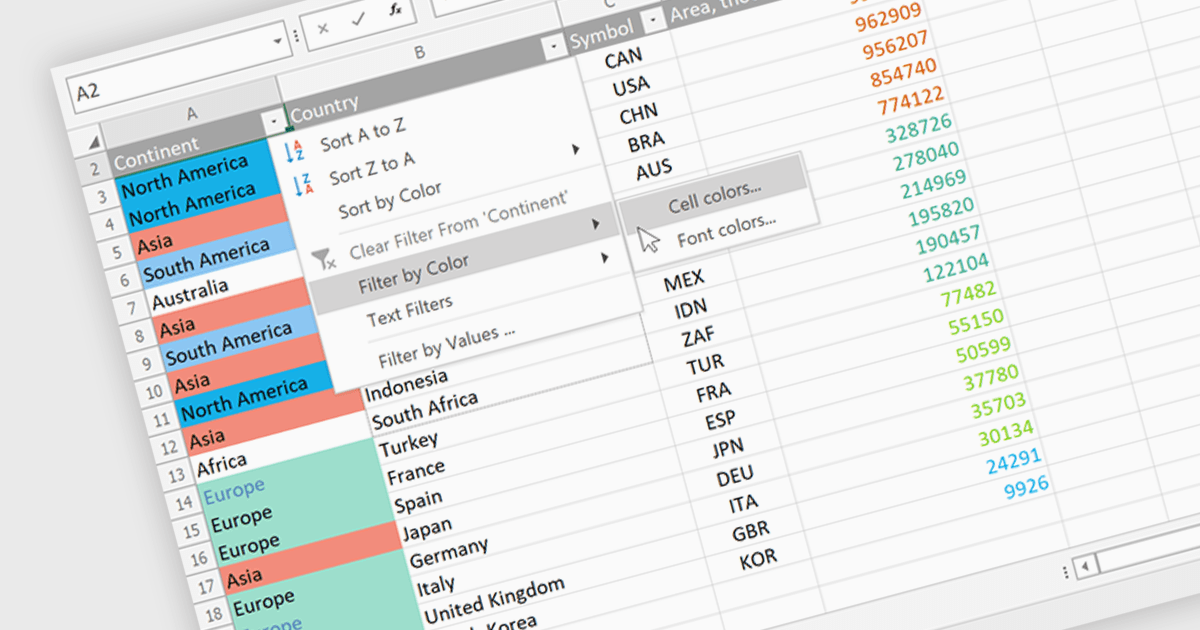
Data Filtering and Grouping in a .NET spreadsheet control enables developers to organize and display worksheet data more effectively by allowing users to filter rows based on specific criteria and group related rows or columns into expandable sections. These capabilities make it easier to work with large datasets, focus on relevant information, improve worksheet navigation, and present data in a more structured way without modifying the underlying content. By supporting familiar Excel-style functionality, data filtering and grouping also help create more intuitive business applications while maintaining compatibility with spreadsheet workflows.
Several .NET Spreadsheet controls offer data filtering and grouping including:
For an in-depth analysis of features and price, visit our comparison of .NET Spreadsheet controls.
Infragistics is a software company that develops user interface (UI) components, design tools and productivity solutions for software developers. Its products support a range of application platforms, including .NET, JavaScript and web technologies, helping development teams build business applications with advanced data visualization, grids, charts, reporting and user experience capabilities. In addition to developer tools, the company offers low-code application development, embedded analytics and collaborative design solutions for organizations of all sizes.
Effective July 1, Infragistics has discontinued new single-product licenses for Infragistics Ultimate UI for Windows Forms, Infragistics Ultimate UI for WPF, and Infragistics Ultimate UI for ASP.NET. Existing customers can continue to renew their subscriptions, but new licenses for these standalone products are no longer available.
Although new standalone subscriptions are no longer available, these products remain included as part of Infragistics Professional and Infragistics Ultimate. Customers can continue to access the same UI toolkits through these broader subscription offerings.
For more information, visit our Infragistics Ultimate and Infragistics Professional product pages.
Tel: (888) 850 9911
Fax: +1 770 250 6199


