Fornecedor oficial
Como distribuidores oficiais e autorizados, nós fornecemos licenças legítimas diretamente de mais de 200 editores de software.
Ver todas as nossas marcas.

Smart UI by Smart HTML Elements is an enterprise-grade UI library offering pre-built web components for developers in Angular, React, Vue, Blazor, and JavaScript. It boasts over 60 ready-to-use components like grids, charts, schedulers, and editors, all featuring two-way data binding, responsiveness, accessibility, and theming capabilities. This library helps developers rapidly build dynamic and modern web applications with consistent look-and-feel and rich functionalities, accelerating development time and ensuring professional quality.
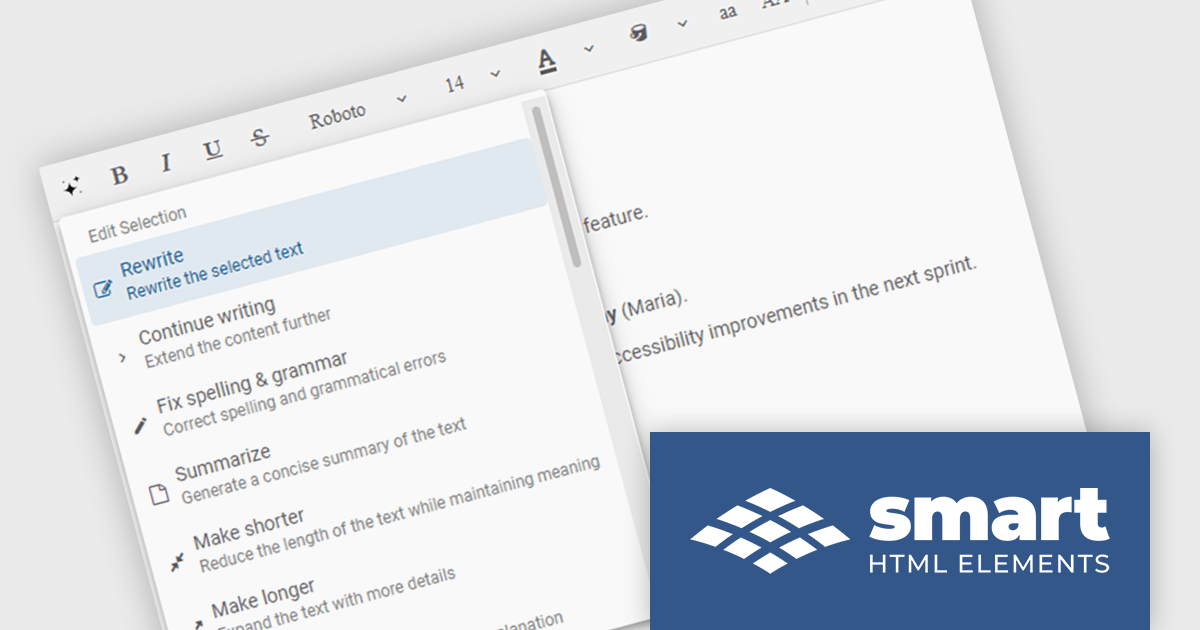
The Smart UI v23.0.0 release adds new features to Smart.Editor, including content generation, text summarization and the ability to rewrite, expand or shorten content by using AI. These capabilities enable users to quickly craft content, distill lengthy text into key points, and tailor messaging with precision, all without leaving the editing environment. Whether expanding a brief idea into a full paragraph or condensing verbose content for clarity, the new AI tools simplify content creation and editing.
To see a full list of what's new in v23.0.0, see our release notes.
Smart UI (Smart HTML Elements) is licensed per developer and is available as a perpetual license with 1 year support and maintenance. It includes distribution to unlimited Web applications, SaaS projects, Intranets and Websites. Team, OEM and Enterprise licensing options are also available. See our Smart UI (Smart HTML Elements) licensing page for full details.
Learn more on our Smart UI product page.

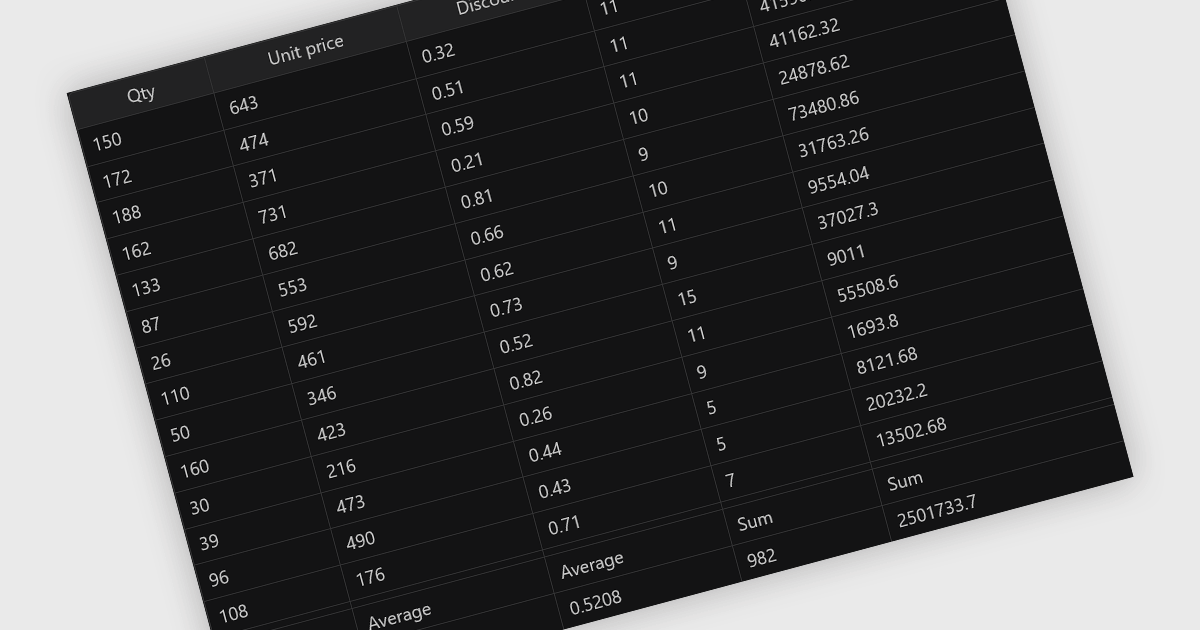
Aggregation in grid components allows users to automatically compute and display summary values, such as totals, averages, minimums, and maximums, across rows or columns of data. This feature enhances the analytical capability of a data grid by offering quick insights directly within the interface, reducing the need to export data for external processing. It is particularly valuable in business intelligence dashboards, financial applications, and administrative tools where on-the-fly data synthesis is essential.
Several React grid controls offer aggregation including:
For an in-depth analysis of features and price, visit our React grid controls comparison.

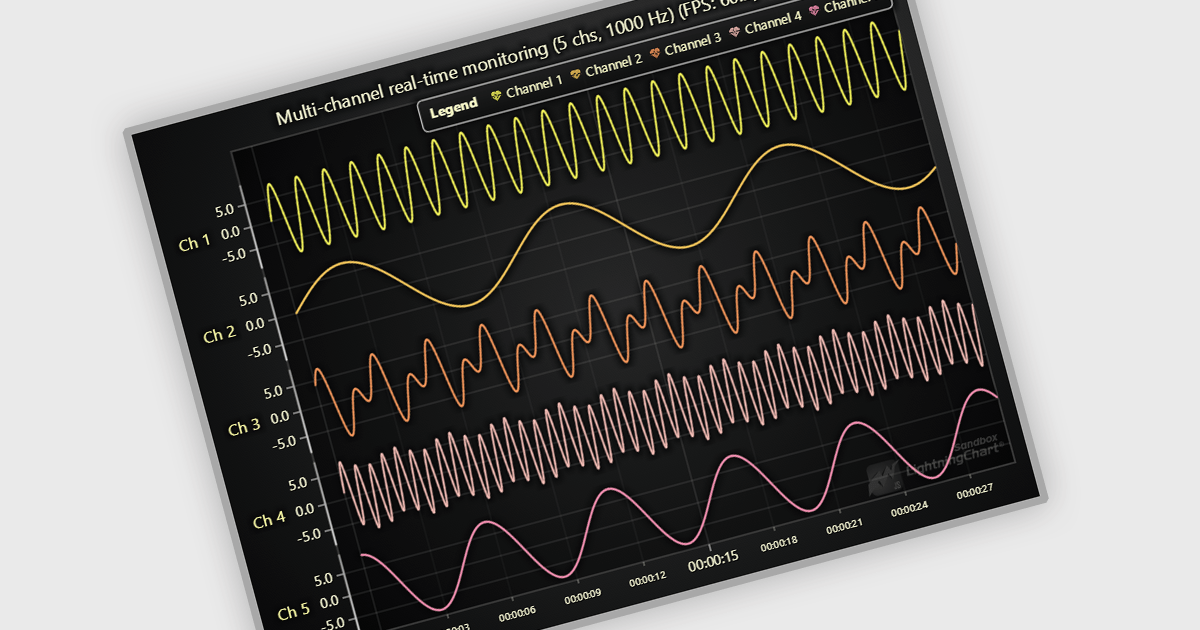
JavaScript API as a data source in React JavaScript Charts refers to the use of custom JavaScript functions or services that fetch and supply data dynamically to chart components at runtime, rather than relying on static datasets. This approach enables charts to reflect real-time data changes, support asynchronous operations, and integrate with external APIs or internal services. It is particularly useful for applications that require up-to-date information, such as dashboards, monitoring tools, or analytics platforms. The key advantage is enhanced flexibility and responsiveness, allowing developers to handle complex data flows, perform live updates, and tailor chart behavior based on interactive or conditional logic.
Several React Chart Controls offer support for using JavaScript API as a data source including:
For an in-depth analysis of features and price, visit our comparison of React Chart Controls.

ComponentSource has played a central role in broadening access to Sencha’s suite of development tools by making them more readily available to a global developer audience. Its distribution infrastructure has helped ensure that organizations - including many in the Fortune 100 - can obtain the tools they need to build and maintain complex, data-driven web applications across platforms.
For five years, ComponentSource has supported developers by providing a straightforward route to acquiring Sencha's products. This collaboration reflects a shared goal: to make software procurement simpler and more reliable, particularly for teams working on large-scale or multi-device applications.
Celebrating a successful 5-year journey, ComponentSource and Sencha look forward to further empowering development teams globally. This continued collaboration aims to enhance the availability and adoption of Sencha's tools, enabling even more organizations to build sophisticated web applications for diverse devices.
For more information, visit our Sencha brand page.

Stimulsoft Reports.JS provides a robust reporting toolkit designed specifically for JavaScript applications. This library leverages a client-side architecture, offering a pure JavaScript report engine for efficient report rendering directly within web browsers. The solution includes a user-friendly report designer for building reports with various data sources and visualizations, along with a report viewer for seamless integration and display within your JavaScript applications. This eliminates the need for server-side dependencies or browser plugins, simplifying the development process for embedding powerful reporting functionalities into your web projects.
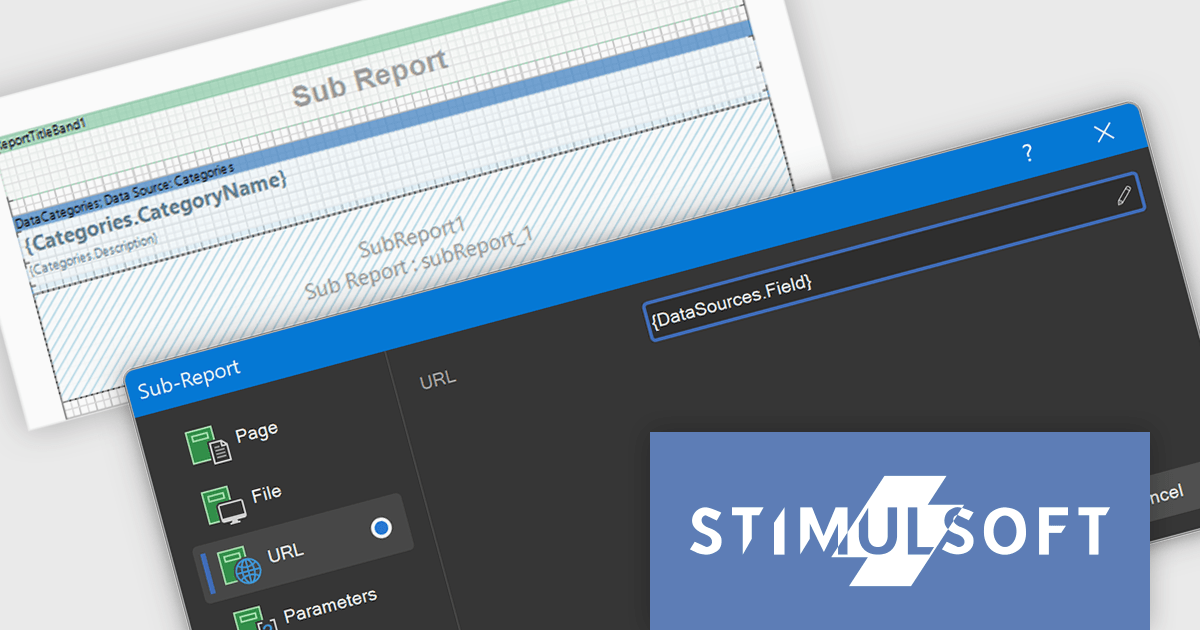
The Stimulsoft Reports.JS includes expressions within the URL and File fields of the Sub-Report component. This functionality helps developers to dynamically determine the source of a sub-report, whether it is a file path or a web address, based on the evaluation of expressions. Consequently, this allows for the creation of more adaptable and context-aware reports where the embedded sub-report content or linked resources are determined programmatically based on the main report's data, offering greater flexibility in report design and data integration without the need for static configurations.
Stimulsoft Reports.JS is licensed per developer and is available as a Perpetual license with 1 year support and maintenance. See our Stimulsoft Reports.JS licensing page for full details.
Stimulsoft Reports.JS is available individually or as part of Stimulsoft Ultimate.