


Fornecedor oficial
Como distribuidores oficiais e autorizados, nós fornecemos licenças legítimas diretamente de mais de 200 editores de software.
Ver todas as nossas marcas.

ComponentSource and Bunifu Technologies are proud to celebrate five years of partnership, working together to provide developers with modern UI components and productivity tools for .NET application development. Since becoming an authorized distributor in 2021, ComponentSource has helped make Bunifu's range of UI controls, charting components, and developer tools more accessible to customers around the world.
A flagship product in the range is the Bunifu Ultimate Bundle, a comprehensive collection of lightweight UI controls, charts, grids, forms, navigation components, and data visualization tools that helps developers create modern, responsive Windows applications more efficiently while reducing development time.
Over the past five years, this collaboration has strengthened ComponentSource's portfolio with high-quality .NET UI development tools, giving customers greater choice when building professional desktop applications. By combining Bunifu Technologies' innovative products with ComponentSource's worldwide eCommerce platform, licensing expertise, and multilingual sales and support services, developers across the globe can easily evaluate, purchase, and deploy Bunifu solutions.
Learn more about Bunifu Technologies.
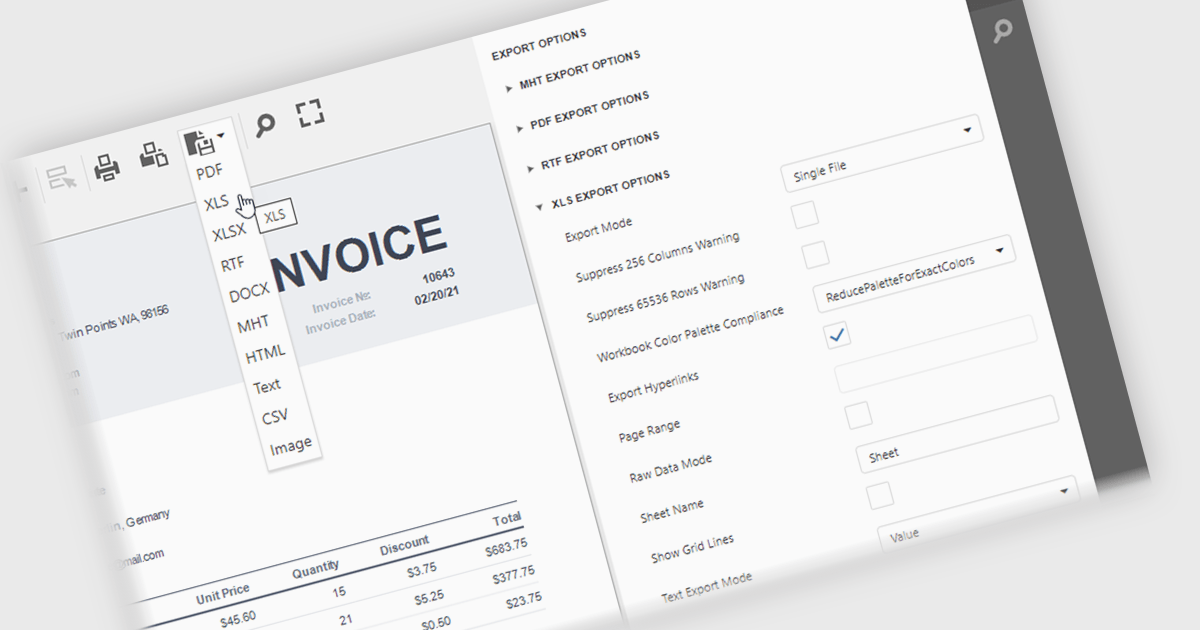
XLS/XLSX export in an ASP.NET Core reporting component allows generated reports to be saved in Microsoft Excel spreadsheet formats while preserving data, formatting, formulas and worksheet structure. This makes it straightforward for users to open report data in Excel for further analysis, filtering, sorting, calculations, or sharing, while giving developers a reliable way to deliver report output in a widely supported business format that integrates well with existing workflows and office productivity tools.
Several ASP.NET Core reporting controls offer export to XLS/XLSX including:
For an in-depth analysis of features and price, visit our ASP.NET Core reporting controls comparison.
DevExpress WPF is a powerful suite of controls that enhances your WPF development toolkit. It offers data grids, ribbon menus, rich text editors, spreadsheets, charts, and more, all with beautiful themes and touch-friendly interfaces. DevExpress WPF helps you to build professional-looking, responsive applications that meet modern user expectations, saving you time and effort while adding polish and functionality.
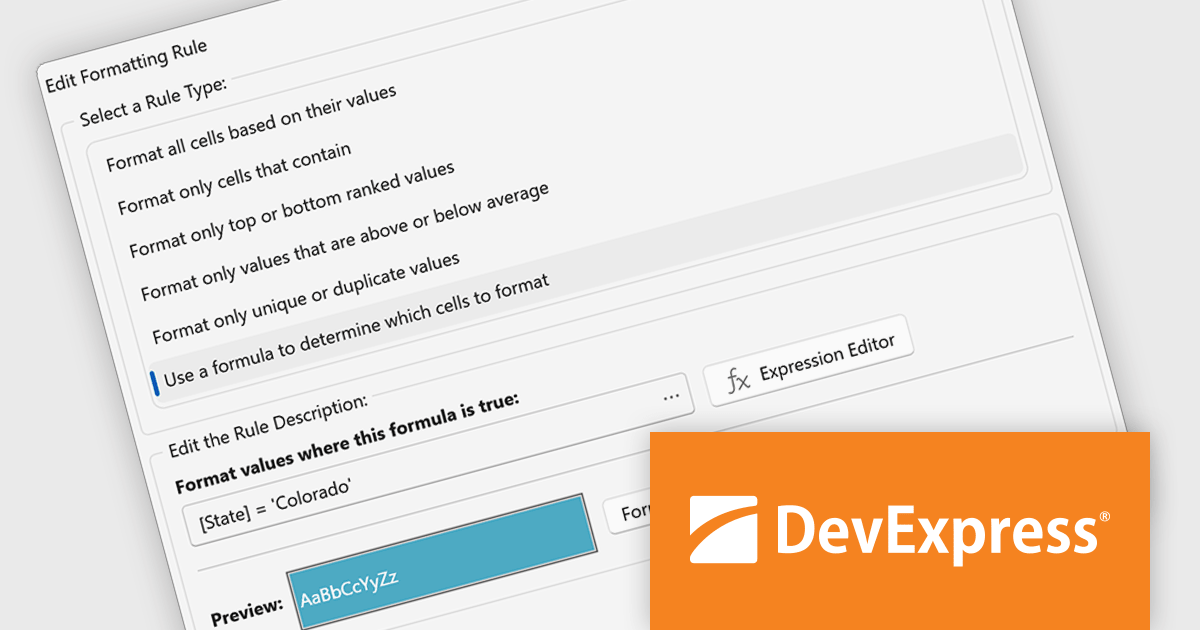
The WPF Data Grid Expression Editor for TableView and TreeListView now supports custom conditional formatting rules. Beyond the predefined formatting options, developers can define complex logical expressions to control how grid data is highlighted. This makes it easier to draw attention to critical values, implement sophisticated business rules, and present data in a way that is more meaningful to end users.
To see a full list of what's new in version 26.1, see our release notes.
DevExpress WPF is licensed per developer and is available as a Perpetual License with a 12 month support and maintenance subscription. We can supply new subscriptions, subscription renewals, and additional licenses. See our DevExpress WPF licensing page for full details.
DevExpress WPF is available to buy in the following products:
Xceed Words for .NET is designed to enable .NET developers to programmatically create, modify, and convert Microsoft Word (.docx) documents without requiring Microsoft Word or Office to be installed. It provides a comprehensive API for manipulating document elements, including paragraphs, tables, images, and formatting, and extends functionality to include PDF conversion, allowing for robust document generation and processing within .NET applications.
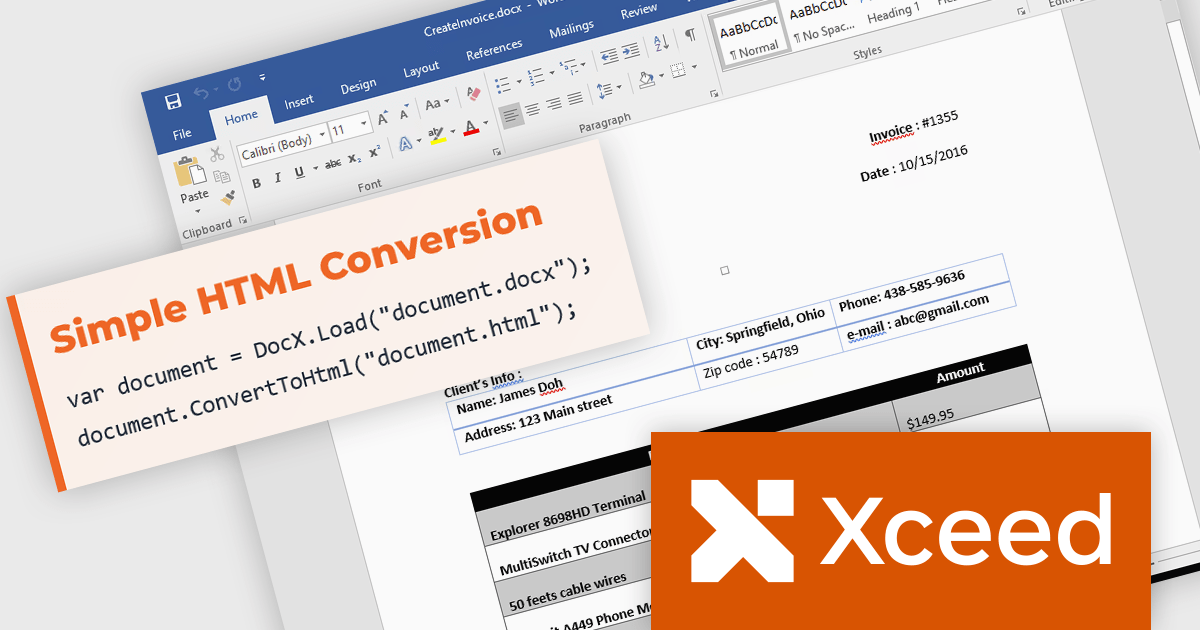
The Xceed Words for .NET 6.0 update introduces Word to HTML conversion, enabling developers to transform Word documents into clean, standards compliant HTML through a single API call. The exporter preserves complex document content including tables, lists, headers, footers, tracked changes, and embedded fonts while providing flexible control over CSS, images, and font handling. Support for multiple HTML and XHTML standards simplifies integration with websites, content management systems, and publishing pipelines, while deterministic output, semantic HTML, ARIA support, and preserved alternative text improve version control, accessibility, and the quality of generated web content.
To see a full list of what's new in version 6.0, see our release notes.
Xceed Words for .NET is licensed per developer and is available as a perpetual license with 1 year of updates and support. See our Xceed Words for .NET licensing page for full details.
Xceed Words for .NET is available individually or as part of Xceed Ultimate Suite.
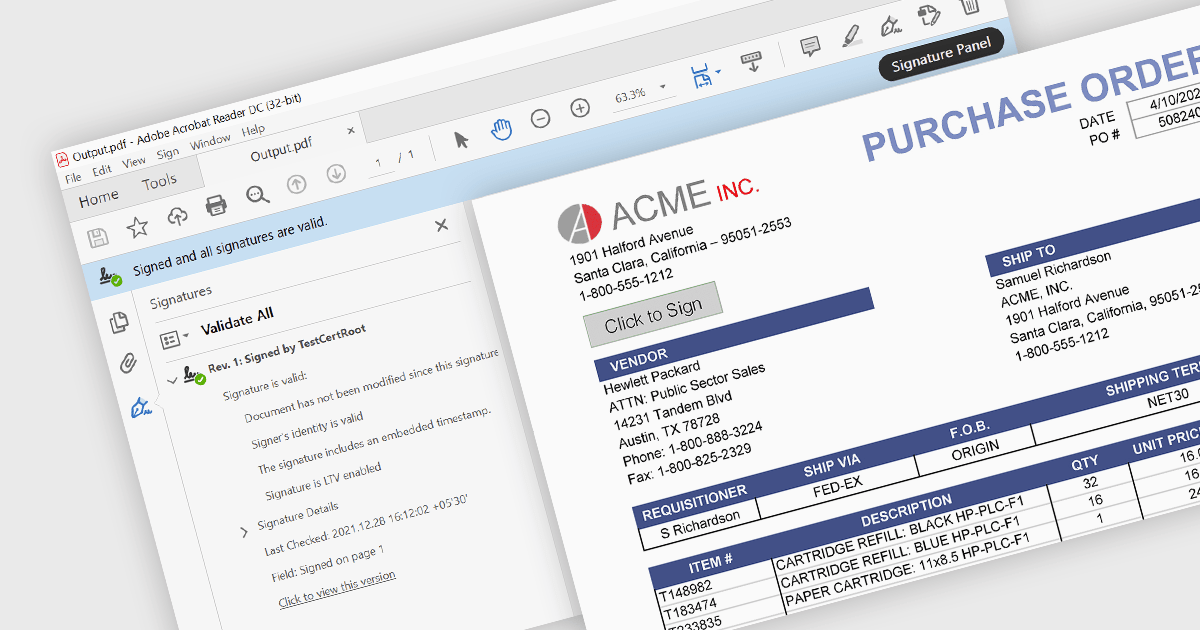
PDF signing is the process of adding a digital signature to a Portable Document Format (PDF) file to help verify the identity associated with the signing certificate and confirm that the signed content has not been altered since the signature was applied. Digital signatures help verify a document's authenticity and integrity while providing evidence of who signed it, making them suitable for contracts, approvals, compliance workflows, and other business processes that require trusted electronic documents. By reducing reliance on printed paperwork and manual signing, PDF signing can also improve efficiency while helping organizations meet security, audit, and regulatory requirements.
Several ASP.NET Core PDF components enable PDF signing, including:
For an in-depth analysis of features and price, visit our comparison of ASP.NET Core PDF components.
Tel: (888) 850 9911
Fax: +1 770 250 6199


