


Fornecedor oficial
Como distribuidores oficiais e autorizados, nós fornecemos licenças legítimas diretamente de mais de 200 editores de software.
Ver todas as nossas marcas.
ComponentOne Studio Enterprise is a comprehensive collection of .NET UI controls, data components, and Wijmo Enterprise JavaScript controls for building desktop, web, and mobile applications. It helps developers create responsive, data driven applications with consistent functionality across platforms while reducing development time through flexible, extensible components. Common use cases include enterprise business software, dashboards, reporting solutions, and line of business applications, with one year of updates, upgrades, new releases, and technical support included.
The ComponentOne 2026 v1 update makes unbound FlexGrid rows use text rendered cells by default, reducing the configuration required to create custom row scenarios. This simplifies grid development, speeds implementation, and provides a more intuitive out of the box experience while preserving the flexibility to customize cell rendering when needed.
ComponentOne Studio products are licensed per developer on a perpetual basis and include a 12 month subscription. Priority Support is also available. See our ComponentOne Studio Enterprise licensing page for full details.
For more information, visit our ComponentOne Studio product pages:
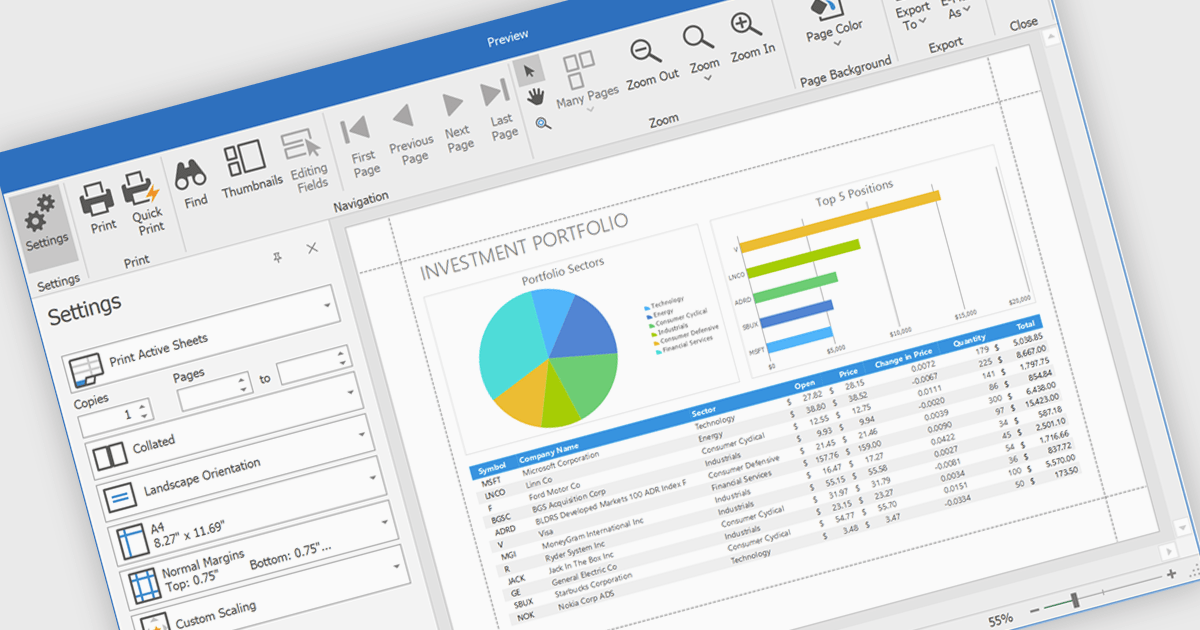
Printing spreadsheets enables users to produce high quality hard copies of worksheets while preserving formatting, tables, charts, images, and page layouts. Features such as print preview, page scaling, margins, and page break controls help ensure content fits correctly on the page, reducing the need for manual adjustments and improving readability. This makes spreadsheet printing valuable for business reports, financial statements, invoices, schedules, inventory lists, project plans, and other documents that need to be shared in meetings, distributed to stakeholders, archived for compliance, or reviewed offline.
Several .NET WinForms spreadsheet components enable printing, including:
For an in-depth analysis of features and price, visit our comparison of .NET WinForms spreadsheet components.
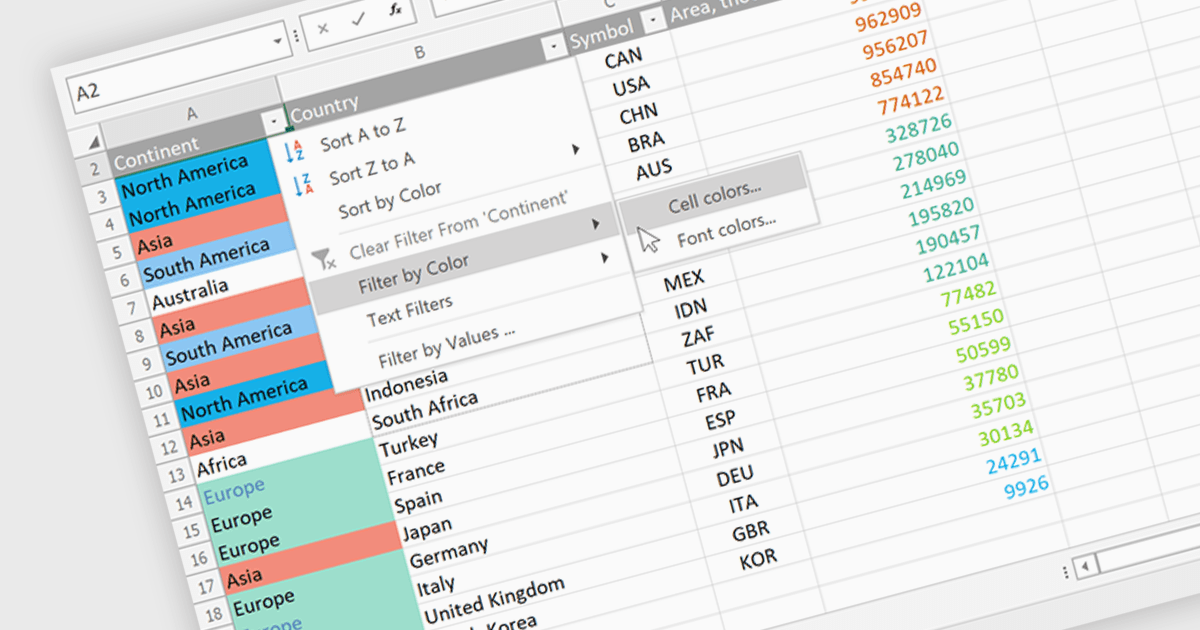
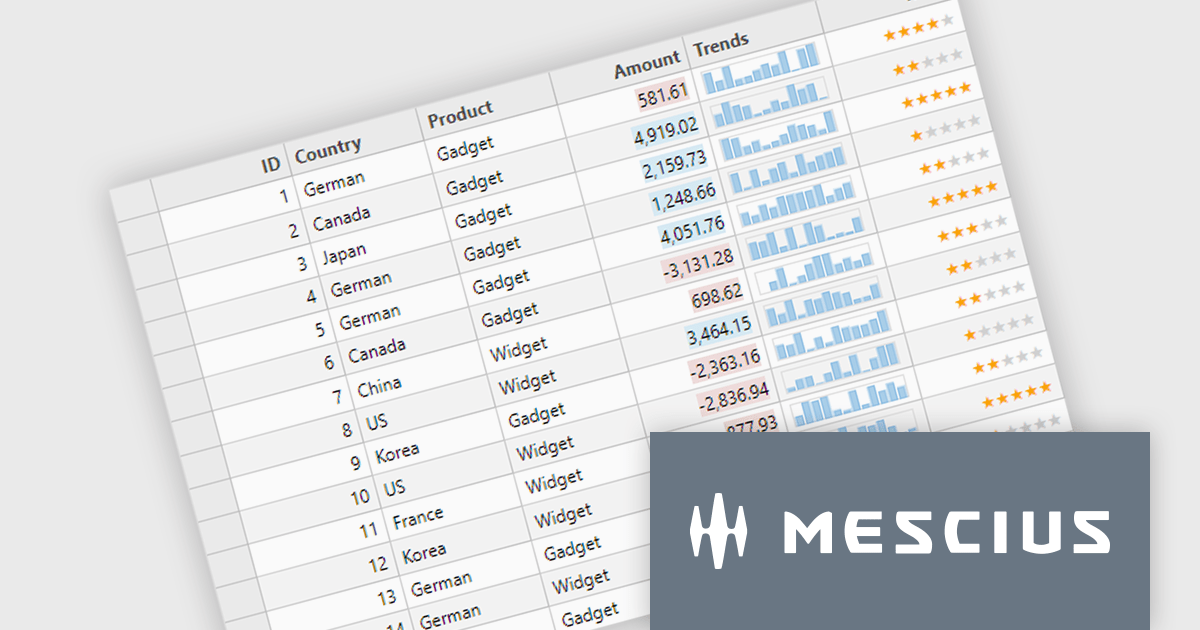
Data Filtering and Grouping in a .NET spreadsheet control enables developers to organize and display worksheet data more effectively by allowing users to filter rows based on specific criteria and group related rows or columns into expandable sections. These capabilities make it easier to work with large datasets, focus on relevant information, improve worksheet navigation, and present data in a more structured way without modifying the underlying content. By supporting familiar Excel-style functionality, data filtering and grouping also help create more intuitive business applications while maintaining compatibility with spreadsheet workflows.
Several .NET Spreadsheet controls offer data filtering and grouping including:
For an in-depth analysis of features and price, visit our comparison of .NET Spreadsheet controls.
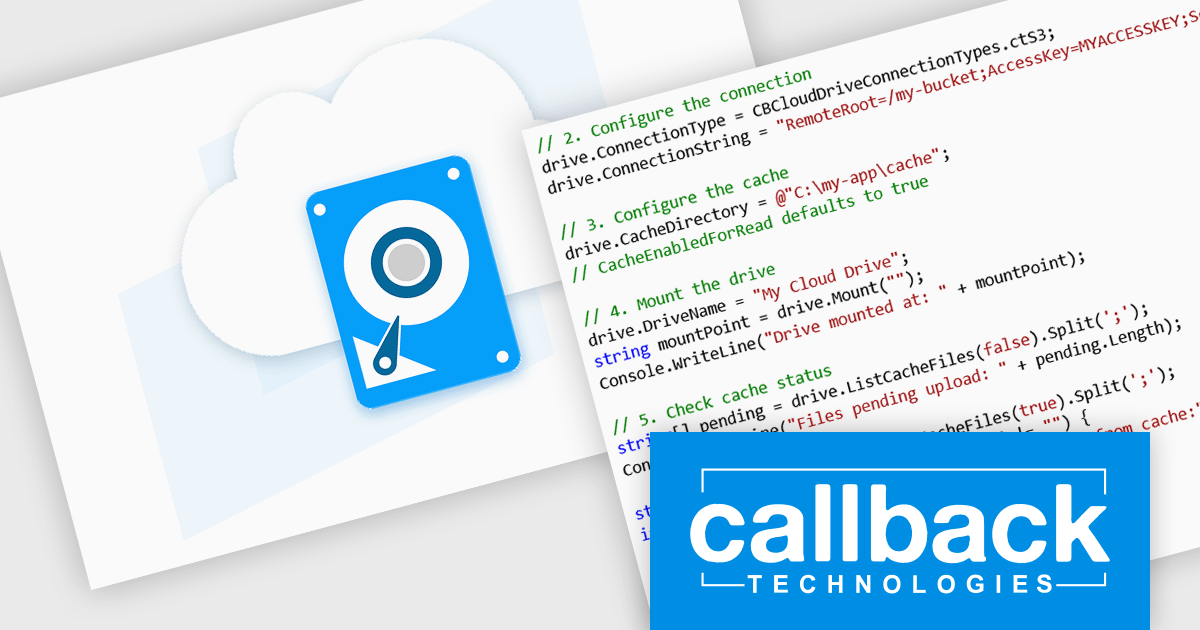
CBFS Cloud is a software development kit (SDK) from Callback Technologies that enables developers to mount cloud and remote storage as local drives within their applications. Instead of building separate integrations for each storage provider, developers use a single API to connect to services such as Amazon S3, Azure Blob Storage, Azure Files, Microsoft OneDrive, SharePoint, Google Drive, WebDAV, SFTP, NFS, and other S3-compatible storage. Once mounted, the remote storage appears as a standard drive that any application can access using normal file system APIs, making cloud-hosted files behave like local files and folders.
The library is designed to hide the complexity of cloud storage integration by providing built-in features such as local read/write caching, background synchronization, conflict detection, and simple mount and unmount operations. Developers create and manage virtual drives entirely in code, without requiring users to install additional drivers or manually configure network drives. CBFS Cloud is suitable for building desktop and server applications that need transparent access to remote storage through a familiar file system interface.
CBFS Cloud is licensed per developer and includes royalty-free distribution. It comes with free upgrades and support for one year. See our CBFS Cloud licensing page for full details.
Learn more on our CBFS Cloud product page.
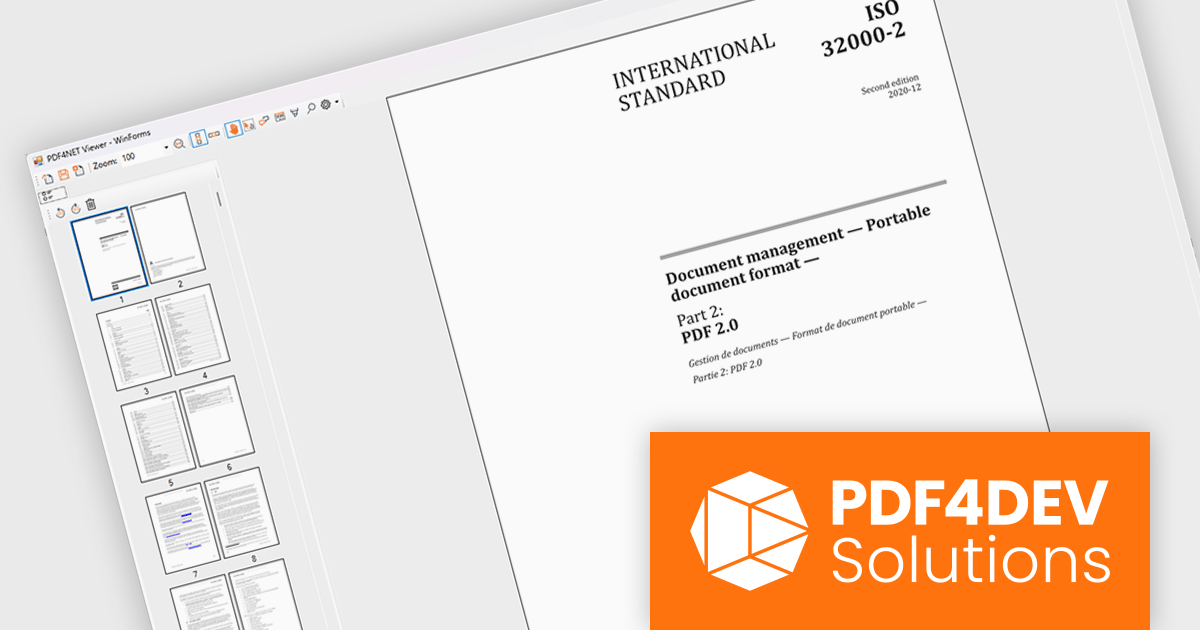
PDF4NET is a .NET library for generating, importing, and manipulating PDF documents on the fly from any .NET application. It does not rely on any Adobe products for creating or importing PDF files. PDF4NET hides the complex structure of PDF files behind a simple object model that allows creation of complex PDF files with a few lines of code.
PDF4NET now includes a PDF page thumbnails viewer control, providing a visual way to browse and navigate PDF documents. By displaying page previews in a dedicated panel, the control helps users move between pages more efficiently, especially in large or complex documents. It can be integrated into desktop applications to deliver a more familiar and user-friendly PDF viewing experience, making document exploration faster and more intuitive.
PDF4NET is licensed per developer. All licenses include a 12 month subscription which provides all major and minor product updates and technical support. See our PDF4NET licensing page for full details.
PDF4NET is available individually or as part of PDFBundle4NET.
Tel: (888) 850 9911
Fax: +1 770 250 6199


