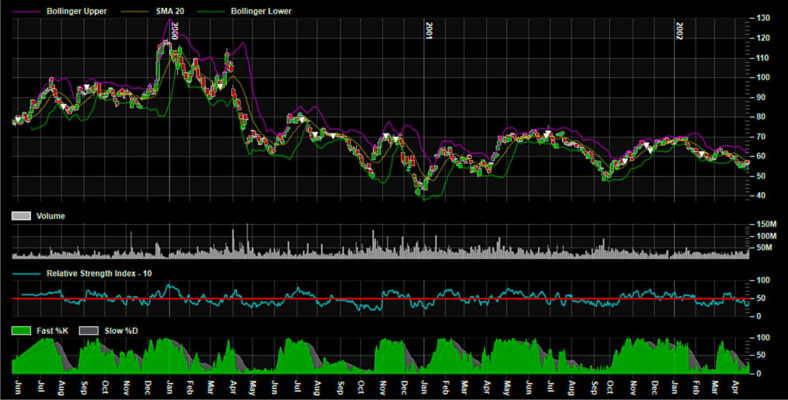
ProEssentials boosts render speed
Released: Apr 19, 2010
Updates in this release
Updates in V7.0
Speed Improvements
- GdiPlus renders significantly faster. For current users, if not using GdiPlus, try it with v7 and set AntiAliasGraphics=True and AntiAliasText = True.
- Built-in automatic data reduction makes handling large data sets faster. Optimization for 2D, 3D, 2D contours, and Polar/Smith charts. Optimization is per plotting method.
- New RenderEngine = PERE_GDI_TURBO, its GDI rendering but much faster and optimized for 2D scatter plots with large data sets. Data reduction of 2D linear and bar type plots can achieve pixel accuracty.
Visual Improvements
- GdiPlus is now the primary target whereas with v6 and earlier we wanted to maintain WMF support. With v7 WMF support is no longer fully supported for all features. Developers may want to set the AllowWmfExport feature to False.
- All plotting routines were rewritten to take full advantage of GdiPlus anti-aliased graphics. Be sure to use AntiAliasGraphics and AntiAliasText set to True.
- Added gradient fill features for everything, at multiple levels: per plotting method, per subset, and per annotation.
- Added bevel and lighting effects on top of gradient effects. Bars, Areas, new SplineAreas, Rect and Polygon Graph Annotations, and TableAnnotations supported.
- Bar and Candlestick charts now have a new optional glass effect.
- Pie charts add new gradient and lighting effects as well as rewritten to render best for GdiPlus and anti-aliased graphics.
- Improved datapoint and marker point sizes allowing minimum and maximum range.
- Pego and Pesgo add grid banding and more subtle grid line coloring options. This is on by default, see GridBands, GridBandsAlpha, GridLineAlpha below. To show a chart in legacy form, set new features GridBold = True and GridBands = False.
Functional Improvements
- Pego, Pesgo, and Pepco now update immediately upon using scrollbars. Also added MouseDraggingX and MouseDraggingY features where the middle mouse button grabs zoomed charts.
- Pego and Pesgo now include a full-featured zoom-window that shows all data below a zoomed chart. Annotations and hot-spots are supported. The level of robustness allows elaborate charting based user interfaces. Added new per annotation type properties GraphAnnotationZoom, HorzLineAnnotationZoom, VertLineAnnotationZoom, and XAxisAnnotationZoom. Allowing annotations to be GRAPH_ONLY, GRAPH_AND_ZOOMWINDOW, or ZOOMWINDOW_ONLY. Related are AllowGraphAnnotHotSpot and per annotation GraphAnnotationHotSpot (and other annotations types) which were expanded to provide similar control of potential hot spot locations.
- Pego and Pesgo adds Spline Area and Spline Ribbon plotting methods.
- Pesgo adds the stacked type plotting methods.
- Basic Polar/Smith charts now support more than one zoom level.
- 3D charts can now have different sized axes. See GridAspectX GridAspectZ below
- GraphAnnotations add angled text, horizontal/vertical regions, and solid arrows. Example 015 adds angled text, example 101 shows a vertical region.
![]()
![]()
![]()
![]()
![]() (2)
(2)


