Fornecedor oficial
Como distribuidores oficiais e autorizados, nós fornecemos licenças legítimas diretamente de mais de 200 editores de software.
Ver todas as nossas marcas.
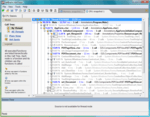
Capturas de tela: A number of informative views (Call Tree, Hot Spots and more) allow convenient inspection of profiling data stored in snapshots. The importance of each function call is represented with descriptive icons, along with precise execution times and other ...
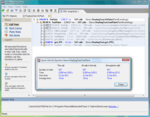
Capturas de tela: You can look up Quick Info on any function from the Call Tree view. The lookup window provides a summary of function statistics with respect to the selected call and to all calls in the current tab. ...
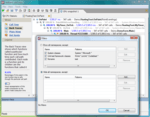
Capturas de tela: You can apply predefined and customizable filter patterns to focus on the functions most important to you. Filter out system calls and other nonessential functions with a combination of different Hide filters. Emphasize specific functions of selected ...
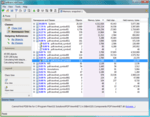
Capturas de tela: With dotTrace you can quickly profile the memory usage of your.NET applications. The profiling process is not only simple but fast. A wealth of profiling data is accurately recorded and presented in the form of memory snapshots, allowing thorough analysis ...
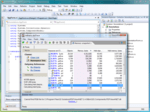
Capturas de tela: You can run dotTrace from Visual Studio. With the click of a button you can profile the StartUp project of your solution in Visual Studio. ...
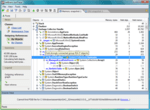
Capturas de tela: When you are navigating though the graph of objects in memory, some dependencies are difficult to see at a glance. dotTrace offers an easy way to merge (group) strongly-connected objects together, so that you can see which objects and/or groups any ...