Offizieller Lieferant
Als offizieller und autorisierter Distributor beliefern wir Sie mit legitimen Lizenzen direkt von mehr als 200 Softwareherstellern.
Sehen Sie alle unsere Marken.
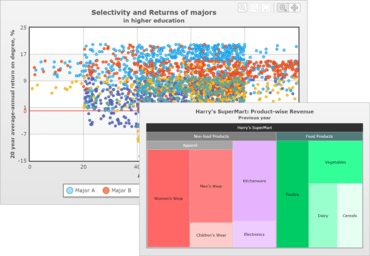
FusionCharts Suite XT is an industry leading JavaScript charting library that offers a unified experience across all devices and browsers. It can render over 90 charts and gauges in JavaScript (HTML5), along with 960+ data-driven maps. It features tool-tips, clickable legend keys, drill-downs, scrolling and zooming. FusionCharts Suite XT works well with both XML and JSON data, and can be easily integrated with any JavaScript framework or a server-side technology e.g. ASP.NET, PHP, Python, Java, Ruby on Rails etc.
FusionCharts is one of the industry's leading providers of Enterprise-grade data visualization solutions. 20,000 customers and 450,000 users in 118 countries trust and use FusionCharts products to add delight to their web and Enterprise applications. Their customers include most Fortune 500 companies, the top business intelligence organizations, and some of the web's most popular websites.

JavaScript (HTML5)-Diagramme und -Messanzeigen, die auf verschiedenen Geräten und Plattformen funktionieren.
Live-Chat mit unseren FusionCharts-Lizenzierungs-Spezialisten.