Stimulsoft Reports.Wpf 2017.1

Die Map-Komponente unterstützt jetzt auch Gruppierungen und integriert einen neuen TreeMap-Diagrammtyp.
April 27, 2017
Neue Version

Funktionen

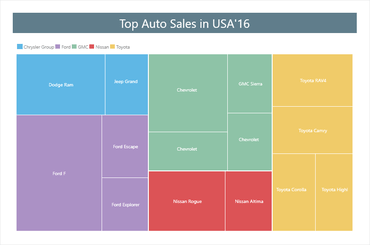
  • TreeMap chart - When designing reports for data visualization you can now use a TreeMap chart. This diagram provides the ability to display a hierarchical view of the data.
  • Anchor property - When a report component is placed on another one, you can set the anchors of the component.
  • Group sum in the Map component - If you use the Map component in a report, you can group data by countries or by continents, for example.
TreeMap chart.

Stimulsoft Reports.WPF

Integrieren Sie das Reporting in Ihre WPF-Anwendungen.

Sie haben eine Frage?

Live-Chat mit unseren Stimulsoft-Lizenzierungs-Spezialisten.