Stimulsoft 2022.4.2

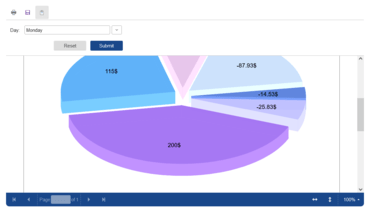
Integriert interaktive Funktionen für 3D-Diagramme in Berichte und Dashboard.
Oktober 10, 2022
Neue Version

Funktionen

  • Added property groups 'Axis X' and 'Axis Y' for three-dimensional charts in dashboards (WIN, Designer).
  • Added 'Side-by-Side' property for 3D charts in dashboards (WIN, WEB, JS, Cloud, Designer, Server).
  • Added a new data adapter that lets you connect to MariaDB data stores (WEB, Cloud, Server).
  • Added the ability to horizontally align text in the column headers of 'Table' elements in dashboards (WEB, JS, Cloud, Server).
  • Added a new 'Parameter Width' property for report templates (WEB, JS, Cloud, Server).
  • Specify the behavior of view controls on 'Chart' elements. View controls can now be always displayed or only on hover. Customization is done in chart interaction editor (WEB, JS, Cloud Server).
  • Added interactive features for 3D charts in reports and dashboards (JS).
  • Updated the Microsoft Edge WebView2 component to version 1.0.1343.22 (WIN).
  • Updated and improved the algorithm for drawing 3D charts for small series values (.NET, JS, WPF, WIN, Designer).
Stimulsoft Ultimate

Stimulsoft Ultimate

Rendern Sie Berichte und Übersichten in Ihren Anwendungen.

Sie haben eine Frage?

Live-Chat mit unseren Stimulsoft-Lizenzierungs-Spezialisten.