Offizieller Lieferant
Als offizieller und autorisierter Distributor beliefern wir Sie mit legitimen Lizenzen direkt von mehr als 200 Softwareherstellern.
Sehen Sie alle unsere Marken.
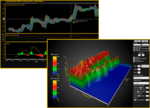
Beschreibung: capacity of 16 billion data points in real-time with low-resource consumption, suitable for the most demanding industries with a 170+ library of 2D and 3D graphics. "LightningChart has proven ... to be implemented in demanding industries’ (science and research, engineering, economics and finance, trading, medicine, energy, space and defense) data visualization application development. Visualize complex ... and huge data sets, with LightningChart's optimized series types. LightningChart.NET has recently introduced the SampleDataBlockSeries which is the optimal series type to visualize scrolling/sweeping ...
Versionshinweise: New.NET target framework In the previous versions of LightningChart.NET, the.NET target framework was 4.6.2 or earlier. But, in this release, LightningChart.NET will be targeting Microsoft.NET Framework 4.8 and.NET 6.0. The new built editions will be available for: WinForms. WPF non-bindable. MVVM ...
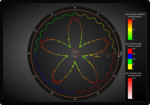
Merkmale: ViewPolar allows data visualization in a polar format. The data point position is determined by angular value and amplitude. Polar view also has versatile zooming and panning features. Series types: ... line, scatter points, point-line, areas. Line colorization per amplitude, angle or data point value. Several polar axes per chart with unique rotation angles. Markers. Sectors. ...
Merkmale: The World's fastest.NET chart with unbeatable performance increases its rendering performance to 16 billion data points in real-time using a mid-level desktop PC. ...
Versionshinweise: Added support for Microsoft.NET 8. 0 ...

Merkmale: A new series fully optimized for real-time applications. It offers the best possible performance with the least CPU and memory consumption, allowing the rendering of an extremely high number of data ... and FreeformPointLineSeries is even bigger. Produces smooth real-time sweeping even with 100 simultaneous series, each with 10 000 000 data points. ...
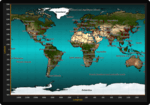
Merkmale: The maps are visualized in ViewXY, and allows combining e.g. routes, heatmaps, or arrows in the same visualization. The maps use equirectangular projection. ...
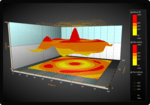
Merkmale: Get 3D charts for WPF and Winforms. Series types: surface mesh, surface grid, waterfall, polygon, rectangle planes, mesh models, line, point-line, scatter points, bar and pie charts. 3D scene settings with multiple light sources. 3D models importing in.obj format. Gigantic surface sizes of over ...
Versionshinweise: Adds DataCursor functionality for all 3D, Polar and Smith series. DataCursor functionality enabled for all 3D, Polar and Smith series. DataCursor allows the user to explore a series and the closest value to the mouse cursor will be automatically tracked. 3D TransparencyRenderMode property is now ...

Beschreibung: capacity of 16 billion data points in real-time with low-resource consumption, suitable for the most demanding industries with a 170+ library of 2D and 3D graphics. "LightningChart has proven to be the ... implemented in demanding industries’ (science and research, engineering, economics and finance, trading, medicine, energy, space and defense) data visualization application development. Visualize complex and ... huge data sets, with LightningChart's optimized series types. LightningChart.NET has recently introduced the SampleDataBlockSeries which is the optimal series type to visualize scrolling/sweeping ...

Versionshinweise: Includes new DataCursor features for automated data tracking in the chart. DataCursor: new feature for automated data tracking in the chart. Now, all the ViewXY series can be explored using ... DataCursor. This is a new class/object that shows the series data value at or near the mouse position. The DataCursor class consists of X&Y axis labels, a result table, a color bar, and haircross lines. ... Zoom bar- The ZoomBar custom control can be added to the application layout (grid, panel) as well as to the main Chart (XY). All the data from the reference Chart is then copied to the ZoomBar control ...
Versionshinweise: of LineSeriesCursor and potency of library in EEG data visualization. Many minor errors have been fixed in the library code. 0 ...
Versionshinweise: New line series use less resources and offer significantly improved performance. New and Faster Line Series- SampleDataBlockSeries remains the fastest series to display float/double type of data ... . However, it requires fixed interval progressive x-value data. This release introduces faster versions of many existing line series, for which this requirement is less strict or not applicable. These series ... of a bitmap image. StockSeries & TradingChart Changes: StockSeries has been improved: Added the Packing feature. When enabled, the data values close to each other will be rendered as a single item. Improved ...

Merkmale: and Money Flow Index support data from MarketStack data provider which allows the update of real-time financial data minute by minute. ...
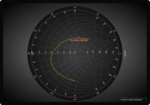
Merkmale: or data only. Zooming and panning via ready-made mouse operations. Tick values always visible, even when zoomed in close. Data and grid clipping to graph area. You can show data also on outside ...
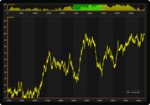
Merkmale: Visualize your complex and huge data sets, with the optimized series types, shared X axes, built-in real-time scrolling modes and industry leading configuration options. Series types: sampled data ... Annotations, markers, data cursors. Persistent rendering layers. Several legend boxes in the same chart. Linear and logarithmic axes, X axis scale breaks. Several configurable vertical segments in chart, layered ...
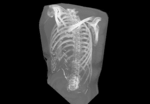
Merkmale: data. Three options for Volume Rendering Ray function: accumulation, maximal intensity and isosurface. Combining 3D models and series in the same visualization. ...
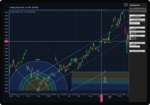
Merkmale: Easy-to-use, easy-to-integrate, trading charts with basic Technical Indicators and Drawing Tools. The easiest approach for making apps for Trading and Technical Analysis. Data fetching from web ...
Versionshinweise: Adds support for.NET 6 and updates UWP charts compatibility with Microsoft Store. Adds support for Microsoft.NET 6 UWP charts are now fully compatible with Microsoft Store. Improves the performance and stability of the SampleDataBlockSeries. Better support for DPI awareness and particularly, per ...
Kompatibilität: Product Type Component Component Type.NET WinForms.NET WPF UWP Controls Compatible Containers Visual Studio 2022 Visual Studio 2019 Visual Studio 2017 Visual Studio 2015 Visual Studio 2013 Visual Studio 2012 Visual Studio 2010 DirectX 9.0c (shader model 3) level graphics adapter or newer, or ...