Offizieller Lieferant
Als offizieller und autorisierter Distributor beliefern wir Sie mit legitimen Lizenzen direkt von mehr als 200 Softwareherstellern.
Sehen Sie alle unsere Marken.

Beschreibung: Customizable Data Tips Documentation Framework Adapters React Adapters Angular Adapters Vue.js Adapters ... Lesen Sie mehr Weitere Ergebnisse von diesem Produkt anzeigen
Beschreibung: Eine radiale Linien- und Bereichsflächenvisualisierung. Vizuly Corona is a radial chart that provides angular and curved radial area line curves and supports both an overlap and stacked layout. It also features over a dozen different dynamic styles and comes bundled with an easy to use test ... Lesen Sie mehr
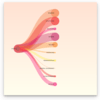
Beschreibung: support Customizable Data Tips Documentation Framework Adapters React Adapters Angular Adapters Vue.js ... Lesen Sie mehr Weitere Ergebnisse von diesem Produkt anzeigen
Beschreibung: Darstellen asymmetrischer hierarchischer Informationen in einer leicht lesbaren Visualisierung. Vizuly Weighted Tree nodes and branches can be dynamically sized and styled based on data bound properties that you set. One challenge with large hierarchal tree structures is being able to easily ... Lesen Sie mehr

Beschreibung: properties and interactive event support Customizable Data Tips Documentation Framework Adapters React ... Lesen Sie mehr Weitere Ergebnisse von diesem Produkt anzeigen
Beschreibung: Darstellen von Transaktionsbeziehungen einer bestimmten Anzahl von Quellen zu einer variablen Anzahl von Zielen. Vizuly Halo uses several different data visualization techniques to represent transactional relationships from a specified number of sources to a variable number of targets. Sources are ... Lesen Sie mehr

Beschreibung: Dozens of adjustable properties and interactive event support Customizable Data Tips Documentation ... Lesen Sie mehr Weitere Ergebnisse von diesem Produkt anzeigen
Beschreibung: Darstellen kartesischer x/y-Daten innerhalb eines radialen Plots. Vizuly Radial Bar is designed to represent cartesian x/y data within a radial plot. It supports both clustered and stacked radial bars Use the interactive style explorer on the left to view different style settings, themes, and other ... Lesen Sie mehr
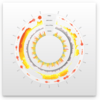
Beschreibung: Dozens of adjustable properties and interactive event support Customizable Data Tips Documentation ... Lesen Sie mehr Weitere Ergebnisse von diesem Produkt anzeigen
Beschreibung: Einfach multivariate Zeitreiheninformationen anzeigen. Vizuly Ring Chart lets you easily display multi-variate time series information. Due to its radial form factor, you can display 3 times the information for a given screen width than you could with a more traditional cartesian layout. You can ... Lesen Sie mehr
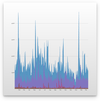
Beschreibung: Tips Documentation Framework Adapters React Adapters Angular Adapters Vue.js Adapters ... Lesen Sie mehr Weitere Ergebnisse von diesem Produkt anzeigen
Beschreibung: Integrieren Sie interaktive Linien- und Bereichsdiagramme in Ihre JavaScript-Apps. Vizuly Line Area Chart supports both line and area plots in several different layout options. It also comes bundled with a test container demonstrating the various chart properties and different style themes. You can ... Lesen Sie mehr
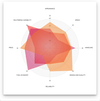
Beschreibung: Documentation Framework Adapters React Adapters Angular Adapters Vue.js Adapters ... Lesen Sie mehr Weitere Ergebnisse von diesem Produkt anzeigen
Beschreibung: Integrieren Sie Radardiagramme in Ihre JavaScript-Apps. Vizuly Radar Chart graphs multiple dimensions of one datum along multiple radial axis. Each plot represents 3 or more data points along shared axis lines. This chart supports highlighting of both individual data points and the group as a whole ... Lesen Sie mehr
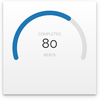
Beschreibung: Customizable top/bottom/value labels 6 example themes More than a dozen dynamic styles Documentation Framework ... Lesen Sie mehr Weitere Ergebnisse von diesem Produkt anzeigen
Beschreibung: Zeigen Sie numerische Werte innerhalb eines minimalen und maximalen Bereichs an. Vizuly Radial Progress is designed to show numeric values within a minimum and maximum range. It can also show when a value has exceeded the maximum threshold. This chart supports a variable range of start/stop angles, ... Lesen Sie mehr
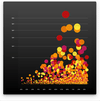
Beschreibung: event support Customizable Data Tips Documentation Framework Adapters React Adapters Angular Adapters ... Lesen Sie mehr Weitere Ergebnisse von diesem Produkt anzeigen
Beschreibung: Integrieren Sie Punktwolkendiagramme in Ihre JavaScript-Apps. Vizuly Scatter Plot shows 3 dimensions of data at once by plotting values along both the x and y axis as well as the radius of the plot itself. Each plot can be colored and styled dynamically based on your data. Features Supports Dynamic ... Lesen Sie mehr
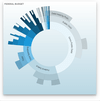
Beschreibung: and interactive event support Customizable Data Tips Documentation Framework Adapters React Adapters Angular ... Lesen Sie mehr Weitere Ergebnisse von diesem Produkt anzeigen
Beschreibung: Integrieren Sie Sunburst-Diagramme in Ihre JavaScript-Apps. Vizuly Sunburst is designed to represent hierarchical data in a radial plot. It supports drill down and drill up capabilities by allowing the user to collapse and expand segments of the sunburst when they click on that area. Features ... Lesen Sie mehr