Vergleich von .NET und JavaScript Diagramme
Bewerten und kaufen Sie beliebte Diagramme in wenigen Minuten.
Speziell für Entwickler entwickelt, um die Wahl von Produkten unter Berücksichtigung von Funktionen, Plattform und Preisen einzugrenzen.

Beschreibung: Add interactive chart web parts to SharePoint pages. Collabion Charts for SharePoint lets you create insightful dashboards in SharePoint, without MOSS or Excel Services. It works with WSS 3.0, MOSS 2007, SharePoint Server 2010, 2013 and 2016, and can plot ... Lesen Sie mehr

Beschreibung: Add line and scatter plot graphs to your ASP.NET applications. LineGraph-5M is a Web Custom Control that allows you to add Line and Scatter Plot graphs to your ASP.NET pages. It can create graphs with an absolute minimum of effort, yet contains enough ... Lesen Sie mehr

Beschreibung: Create animated and interactive charts with hundreds of thousands of data records. ZingChart includes over 50+ built-in chart types and modules that feature interaction with data points and zooming into particular segments. The ZingChart library provides ... Lesen Sie mehr

Beschreibung: A radial line and area layout visualization. Vizuly Corona is a radial chart that provides angular and curved radial area line curves and supports both an overlap and stacked layout. It also features over a dozen different dynamic styles and comes bundled ... Lesen Sie mehr

Beschreibung: Represent transactional relationships from a specified number of sources to a variable number of targets. Vizuly Halo uses several different data visualization techniques to represent transactional relationships from a specified number of sources to a ... Lesen Sie mehr

Beschreibung: Represent cartesian x/y data within a radial plot. Vizuly Radial Bar is designed to represent cartesian x/y data within a radial plot. It supports both clustered and stacked radial bars Use the interactive style explorer on the left to view different ... Lesen Sie mehr

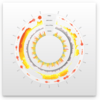
Beschreibung: Easily display multi-variate time series information. Vizuly Ring Chart lets you easily display multi-variate time series information. Due to its radial form factor, you can display 3 times the information for a given screen width than you could with a ... Lesen Sie mehr

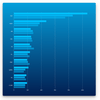
Beschreibung: Add stacked and clustered bar charts to your JavaScript apps. Vizuly Bar Chart supports both stacked and clustered layout options, as well as over 2 dozen different dynamic styles. It also comes bundled with a test container and examples of different ... Lesen Sie mehr

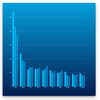
Beschreibung: Add stacked and clustered column charts to your JavaScript apps. Vizuly Column Chart supports both stacked and clustered layout options, as well as over 2 dozen different dynamic styles. It also comes bundled with a test container and examples of ... Lesen Sie mehr

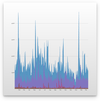
Beschreibung: Add line and area charts to your JavaScript apps. Vizuly Line Area Chart supports both line and area plots in several different layout options. It also comes bundled with a test container demonstrating the various chart properties and different style ... Lesen Sie mehr