


Proveedor oficial
Como distribuidores oficiales y autorizados, le suministramos licencias legítimas directamente de más de 200 editores de software.
Ver todas nuestras marcas.
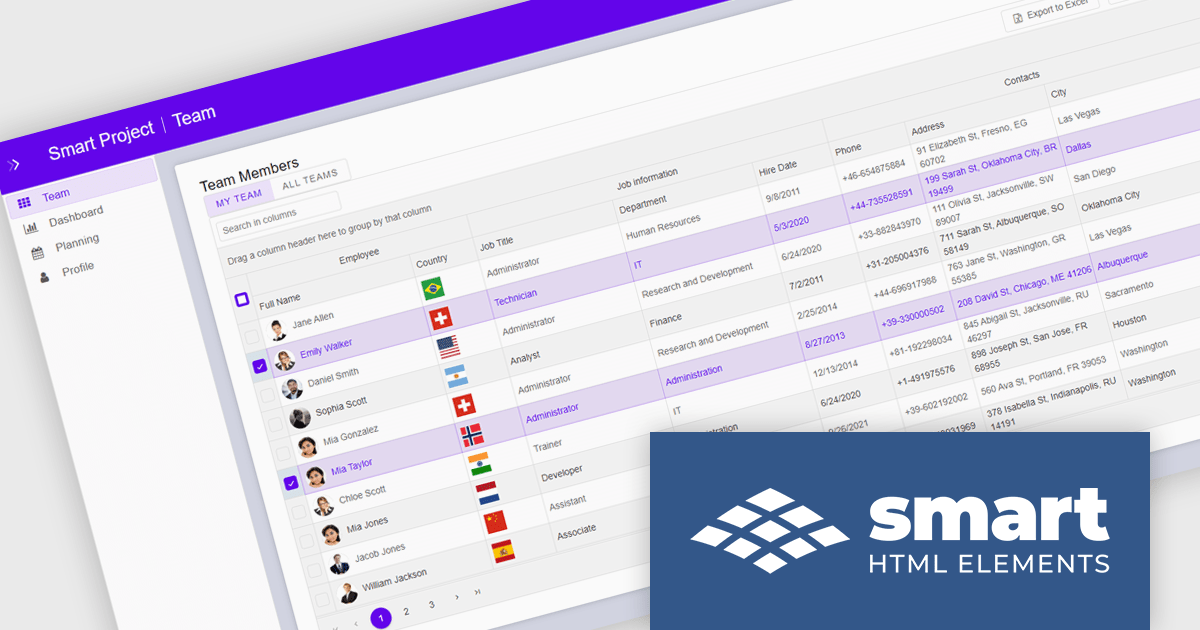
Smart UI by Smart HTML Elements is an enterprise-grade UI library offering pre-built web components for developers in Angular, React, Vue, Blazor, and JavaScript. It boasts over 60 ready-to-use components like grids, charts, schedulers, and editors, all featuring two-way data binding, responsiveness, accessibility, and theming capabilities. This library helps developers rapidly build dynamic and modern web applications with consistent look-and-feel and rich functionalities, accelerating development time and ensuring professional quality.
The Smart UI v26.0.0 update introduces native Data Grid cell comments, enabling software developers to build more collaborative applications with contextual feedback and data annotations directly within tabular interfaces. This feature improves communication during data reviews, validation workflows, and approval processes by allowing users to attach comments to specific cells without relying on external tools or custom implementations.
To see a full list of what's new in v26.0.0, see our release notes.
Smart UI (Smart HTML Elements) is licensed per developer and is available as a perpetual license with 1 year support and maintenance. It includes distribution to unlimited Web applications, SaaS projects, Intranets and Websites. Team, OEM and Enterprise licensing options are also available. See our Smart UI (Smart HTML Elements) licensing page for full details.
Learn more on our Smart UI (Smart HTML Elements) product page.
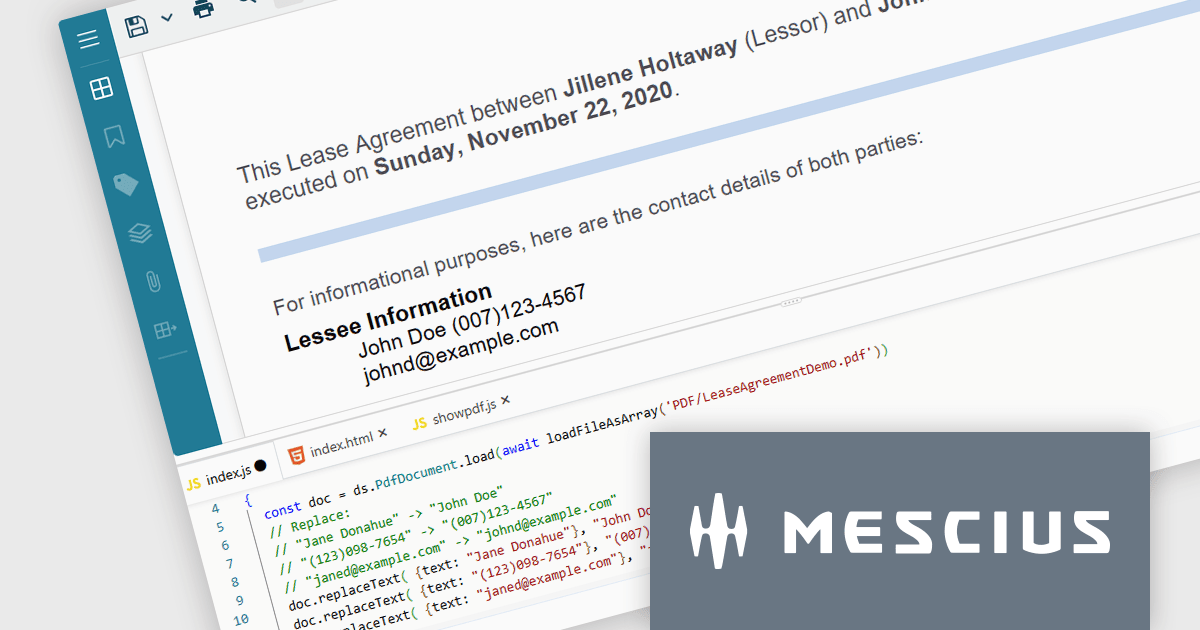
Document Solutions for PDF JS by MESCIUS is a JavaScript PDF API that enables software teams to add PDF functionality to web applications. It supports use cases such as generating documents, modifying existing files, rendering pages, handling forms, converting content, and automating PDF-related processes across browser-based and server-side JavaScript environments.
Beyond core document processing, the product provides tools for creating richer document workflows within custom applications. Its WebAssembly-based engine is designed for efficient performance, while the optional viewer component supports interactive scenarios such as annotation, review, and form filling. This gives teams more control over how PDFs are handled and helps reduce reliance on separate PDF software in reporting, compliance, data collection, and collaboration scenarios.
Document Solutions for PDF JS is licensed per developer and is available in several license options for differing distribution needs. Team licenses are also available for multiple developers within the same organization. See our Document Solutions for PDF JS licensing page for full details.
Learn more on our Document Solutions for PDF JS product page.
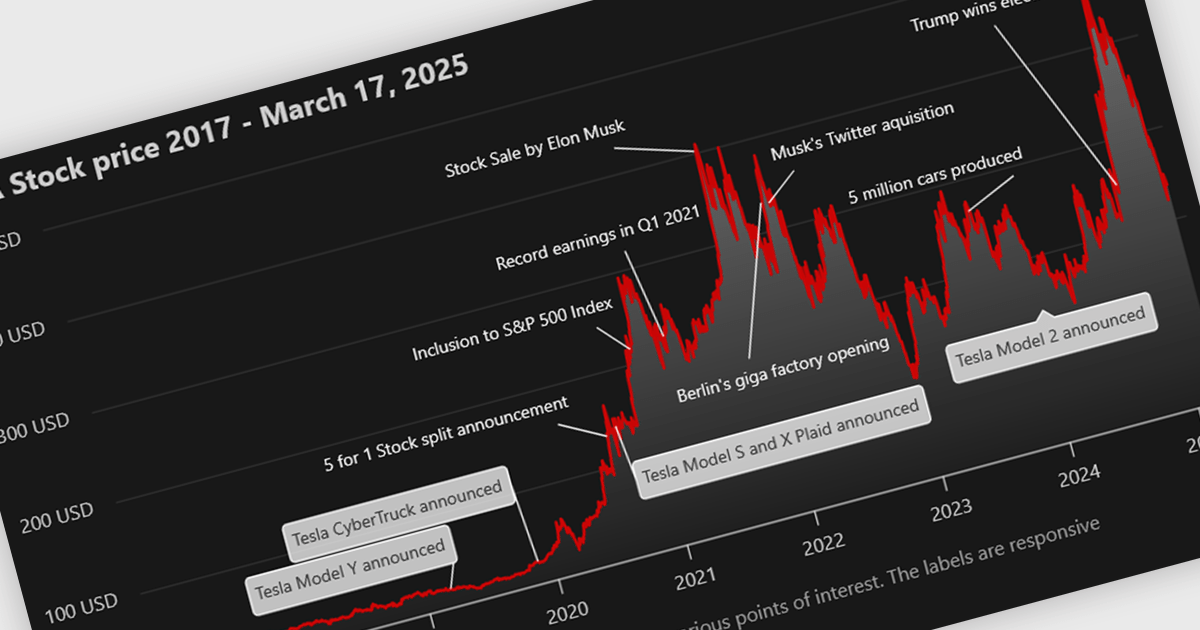
Annotation support in a Vue.js chart component refers to the capability to overlay additional contextual elements, such as labels, markers, lines, or regions, directly onto a chart to highlight specific data points, thresholds, or events. This feature enables developers to enrich visualizations with meaningful insights without altering the underlying dataset, making it easier to communicate key information such as trends, anomalies, or business rules within the UI.
Several Vue.js chart components support chart annotations, including:
For an in-depth analysis of features and price, visit our comparison of Vue.js charting components.
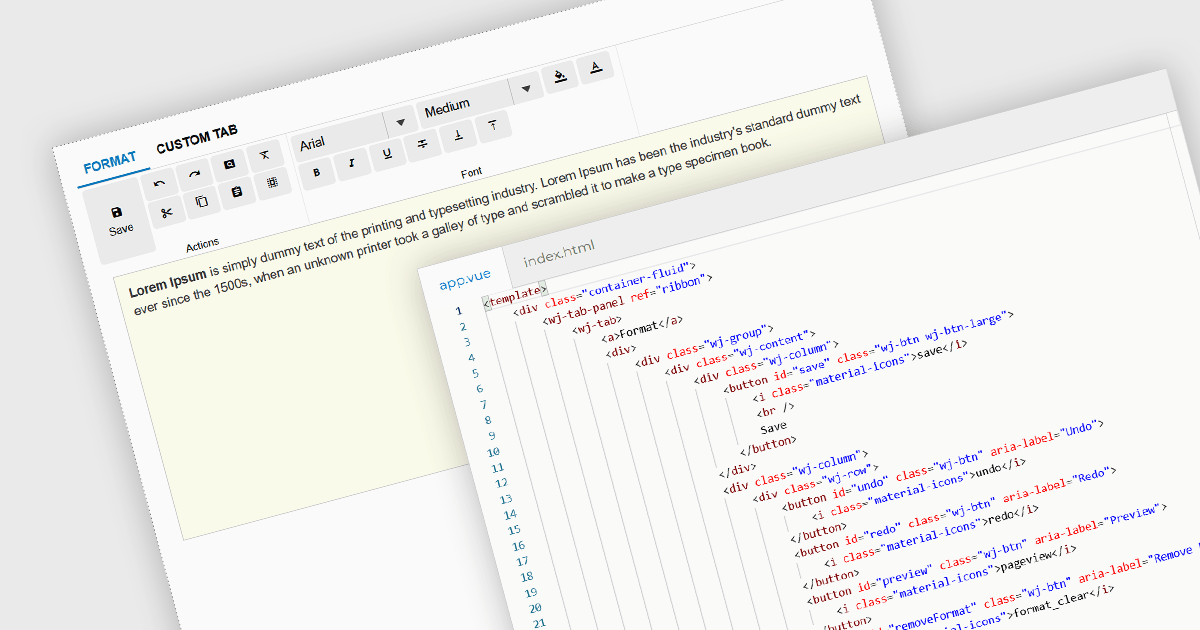
Ribbon bars are graphical user interface (GUI) patterns that organize commands and features into a series of tabs, each containing grouped controls such as buttons, dropdowns, and galleries. Widely adopted in modern software applications, ribbons present functionality in a structured and visually accessible layout to improve discoverability. This approach reduces reliance on deeply nested menus and toolbars, enabling users to locate relevant tools more quickly based on context.
Several Vue.js user interface suites provide ribbon functionality, including:
For an in-depth analysis of features and price, visit our comparison of Vue.js UI suites.
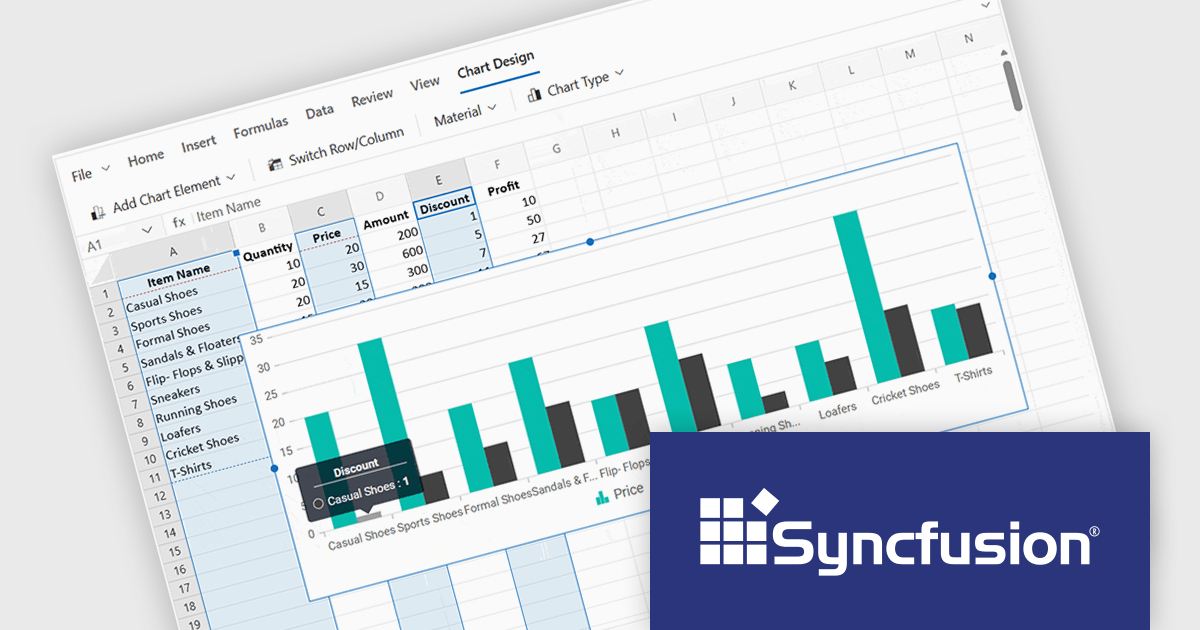
Syncfusion Essential Studio Spreadsheet Editor SDK is a library that lets developers embed spreadsheet functionality into web and desktop applications without requiring Microsoft Excel. It supports editing, formatting, and data analysis features such as cross sheet formula calculation, data binding to local and remote sources including JSON and REST, conditional cell styling, charts, data validation, worksheet protection, and workbook permissions. Available across frameworks including Blazor, React, Angular, Vue, JavaScript, ASP.NET Core and MVC, WPF and WinForms, it helps teams deliver a familiar spreadsheet experience for use cases like reporting, budgeting, and forecasting directly within their applications.
The Syncfusion Essential Studio Spreadsheet Editor SDK 2026 Volume 1 update introduces discontinuous chart range support, enabling developers to create charts from multiple non-adjacent rows, columns, or cell ranges without modifying the original data structure. This capability provides greater flexibility when working with complex, fragmented, or selectively relevant datasets, eliminating the need for manual data consolidation or duplication. It also ensures that charts remain automatically synchronized with updates across all referenced ranges, supporting more accurate, efficient, and maintainable data visualization within modern web and enterprise applications.
To see a full list of what's new in Syncfusion Essential Studio Spreadsheet Editor SDK 2026 Volume 1 (33.1.45), see our release notes.
Syncfusion Essential Studio Spreadsheet Editor SDK is licensed per developer on a one year timed subscription basis, with runtime royalty free redistribution included when the subscription is current, and includes one year of unlimited technical support and updates. See our Syncfusion Essential Studio Spreadsheet Editor SDK licensing page for full details.
Learn more on our Syncfusion Essential Studio Spreadsheet Editor SDK product page.
Tel: (888) 850 9911
Fax: +1 770 250 6199


