Proveedor oficial
Como distribuidores oficiales y autorizados, le suministramos licencias legítimas directamente de más de 200 editores de software.
Ver todas nuestras marcas.
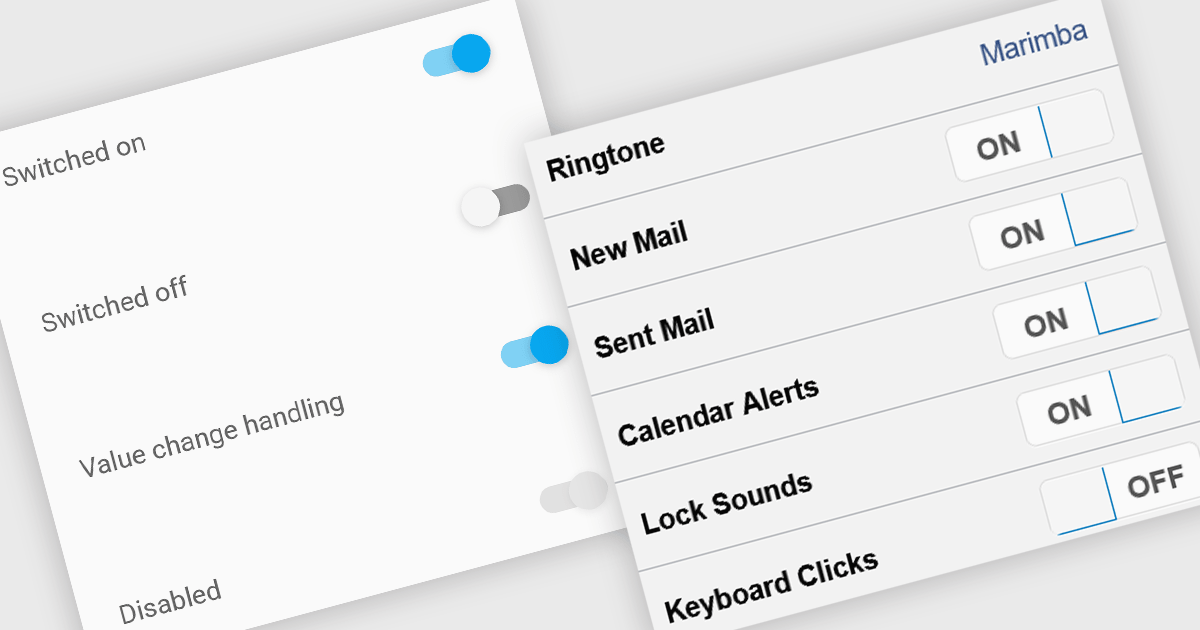
Toggle switches in data editor components provide a user-friendly way to manage boolean values, offering a clear on/off representation that enhances usability. These switches replace traditional checkboxes with a more modern and intuitive interface, making them particularly useful for mobile and web applications where quick interactions are essential. By improving clarity and reducing user errors, toggle switches contribute to a smoother and more efficient data entry experience.
Several Vue.js data editor collections offer toggle switch controls including:
For an in-depth analysis of features and price, visit our Vue.js data editors comparison.
Highcharts is a JavaScript charting framework that allows web developers and data analysts to generate dynamic, visually appealing charts and graphs for websites and web applications. It can display a variety of chart types, including line, spline, area, column, bar, pie, scatter, and many more. Highcharts is well-known for its ease of use, rich documentation, and ability to handle huge datasets efficiently. Features include responsive design, accessibility support, and cross-browser compatibility. Its customization capabilities allow users to create bespoke data visualizations that increase engagement and provide insightful data presentations.
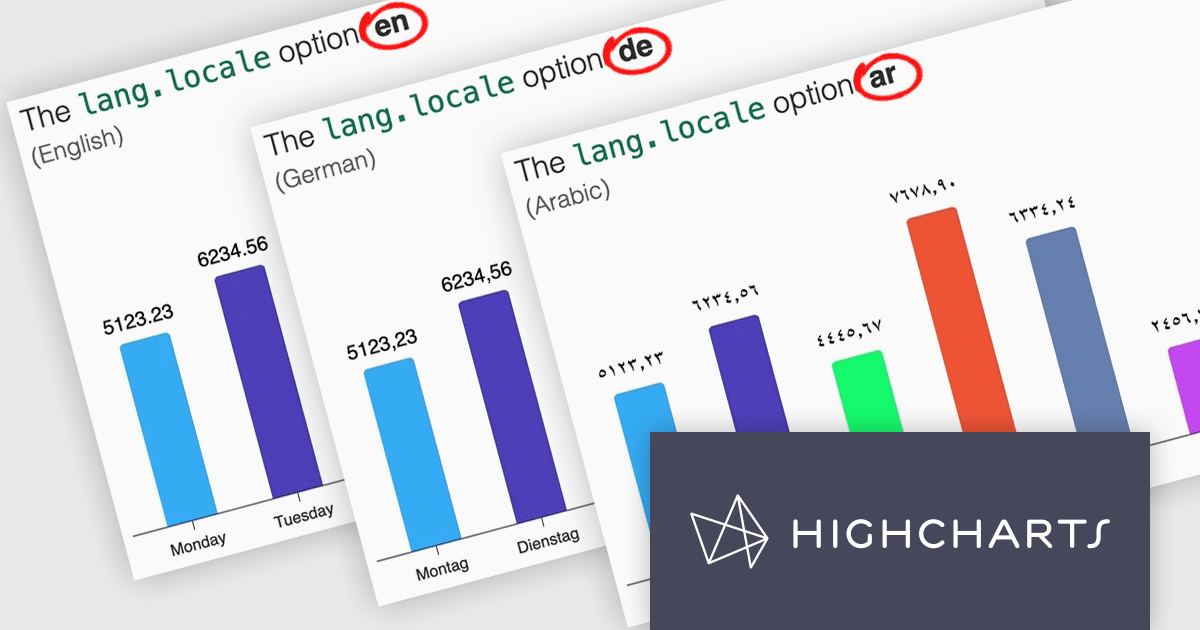
Highcharts v12 introduces the lang.locale option, enabling locale-aware formatting for dates and numbers in charts. This option allows you to define the locale for all charts on a page or set it individually per chart. If no locale is specified, the chart automatically defaults to the page’s or browser’s language settings. Utilizing the browser’s Intl object, lang.locale ensures that dates and numbers are formatted correctly, not only replacing elements like month and weekday names but also structuring entire date expressions according to the selected locale. For instance, American English (en-US) formats a date as January 1, 2025, while British English (en-GB) displays it as 1 January 2025.
To see a full list of what's new in v12, see our release notes.
Highcharts Core is licensed on an annual or perpetual basis, OEM licenses, and Advantage Renewals. It is licensed per Developer and has several license options including Internal, SaaS, SaaS+, and Self Hosted. See our Highcharts Core licensing page for full details.
Learn more on our Highcharts Core product page.
ZingGrid is a JavaScript library that simplifies the creation of interactive data tables and grids within web applications. Utilizing modern web components and focusing on performance and responsiveness, ZingGrid allows developers to implement features like searching, filtering, pagination, and in-line editing with minimal coding. This empowers efficient data visualization and manipulation for users, making it a valuable tool for web development.
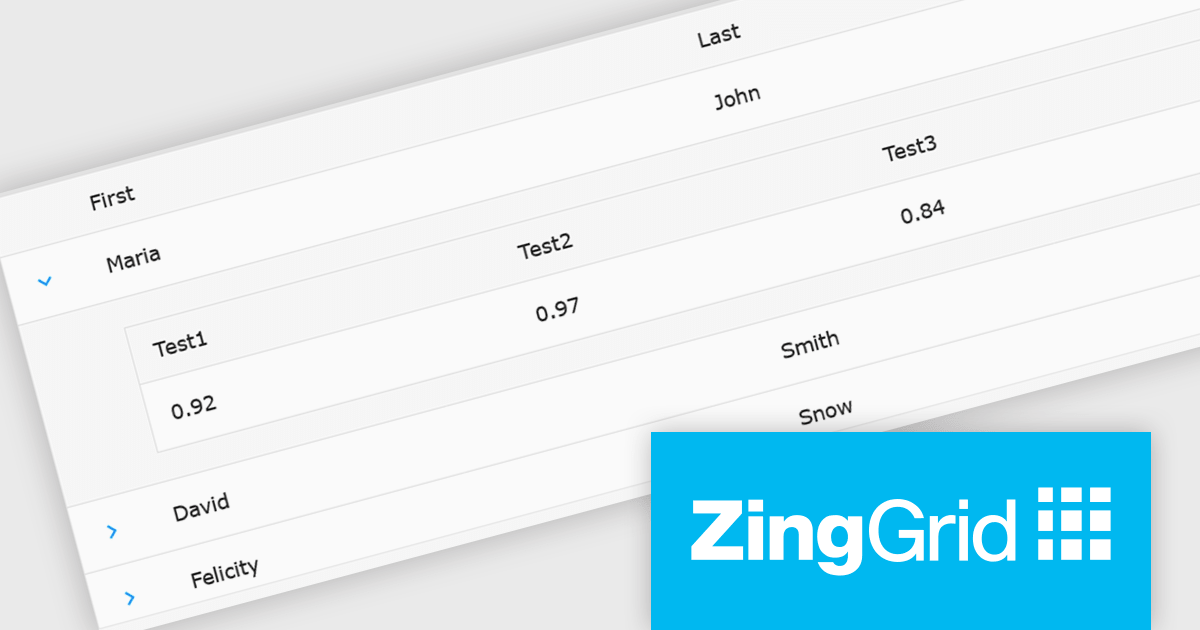
The ZingGrid 2.0.0 release adds new Row Details feature that enhances data presentation by allowing users to expand individual rows and reveal supplementary information. This functionality provides a clean and organized way to display additional data without cluttering the main grid view. Whether you are editing, filtering, searching, or sorting your data, the expanded/collapsed state of each row is intelligently preserved, even across pages. This allows users to maintain context and easily access detailed information without losing their place or having to re-expand rows after interacting with other grid functionalities.
To see a full list of what's new in version 2.0.0, see our release notes.
ZingGrid is available as either a Single-Domain Website or Multi-Domain SaaS license. See our ZingGrid licensing page for full details.
For more information, visit our ZingGrid product page.
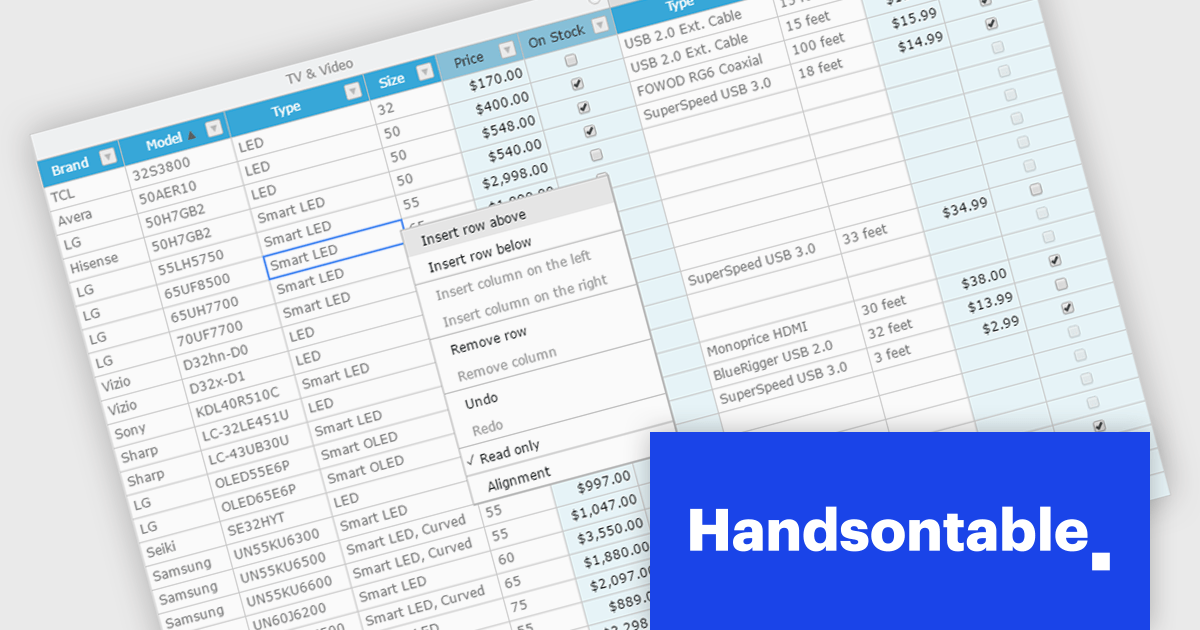
Handsontable is a JavaScript library designed to help developers build interactive data grids into their web applications. Offering a familiar spreadsheet-like interface, it allows users to edit, sort, and filter data with ease. Highly customizable and compatible with popular frameworks like React and Angular, Handsontable empowers developers to build robust data manipulation features into their web applications.
The Handsontable 15.1.0 update enhances table rendering efficiency by reusing and caching cell nodes instead of creating them from scratch during each rendering cycle. This reduces unnecessary DOM manipulations, leading to faster updates, improved responsiveness, and smoother interactions, particularly when handling large datasets. By optimizing how cells are managed, this update minimizes performance bottlenecks, allowing applications to render complex tables more efficiently while maintaining a seamless user experience.
To see a full list of what's new in version 15.1.0, see our release notes.
Handsontable is licensed per developer and is available as an Annual or Perpetual license with 1 year support and maintenance. See our Handsontable licensing page for full details.
For more information, visit our Handsontable product page.
Kendo UI by Telerik is a comprehensive suite of JavaScript UI components designed to accelerate web application development. Offering pre-built, customizable elements for grids, charts, schedulers, and more, it streamlines UI creation across popular frameworks like jQuery, Angular, React, and Vue. Key features include responsive design, accessibility, and high performance, enhancing user experience. Developers benefit from reduced development time, consistent UI patterns, and the ability to build feature-rich applications faster.
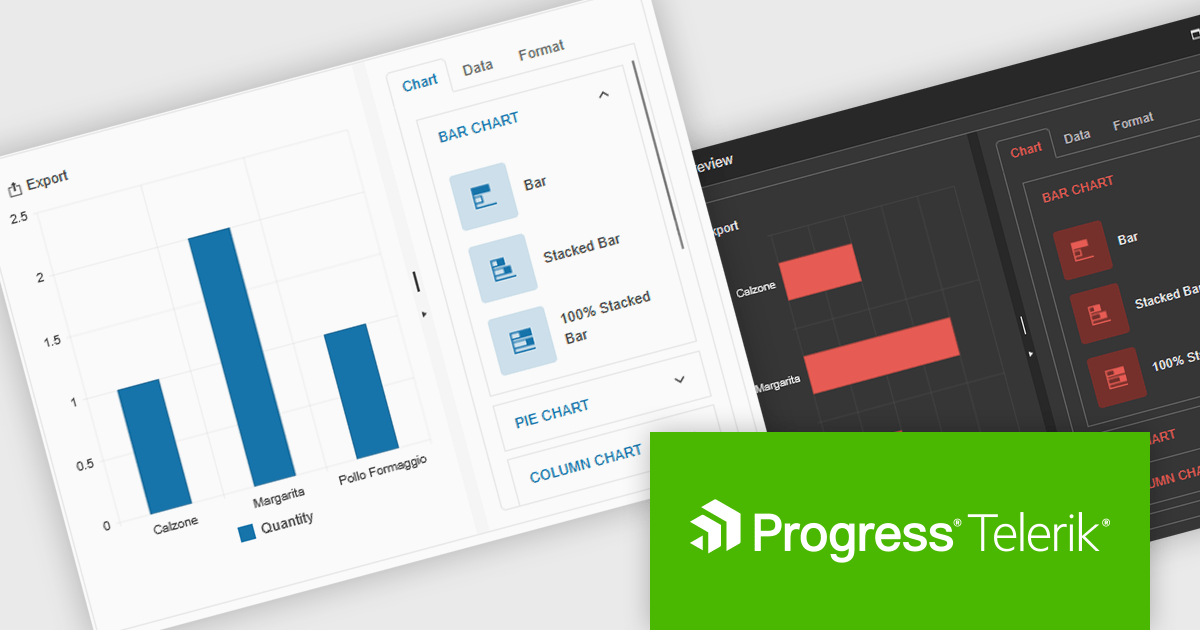
The Kendo UI for jQuery v2025 Q1 update introduces the Chart Wizard, a streamlined tool that simplifies chart creation by allowing developers to generate data-driven visualizations directly from grids, data-bound components, or external sources. This feature reduces manual configuration, enhances workflow efficiency, and ensures a seamless integration process, enabling developers to quickly transform raw data into meaningful insights while maintaining full customization control.
To see a full list of what’s new in v17.1.0 (2025 Q1), see our release notes.
Kendo UI is licensed per developer and has two licensing models: an annual Subscription License and a Perpetual License. The Subscription license provides access to the latest product updates, technical support, and exclusive benefits for a flat annual fee, and must be renewed to continue using the software. The Perpetual license is a one-time purchase granting access to the current released version and includes a one-year subscription for product updates and technical support. After this initial period, users can choose to renew the subscription element to continue receiving updates and support; otherwise, they may continue using the installed version available during their active subscription term but will forgo future updates and support. See our Kendo UI licensing page for full details.
Kendo UI is also available to buy individually or as part of: