













Proveedor oficial
Como distribuidores oficiales y autorizados, le suministramos licencias legítimas directamente de más de 200 editores de software.
Ver todas nuestras marcas.
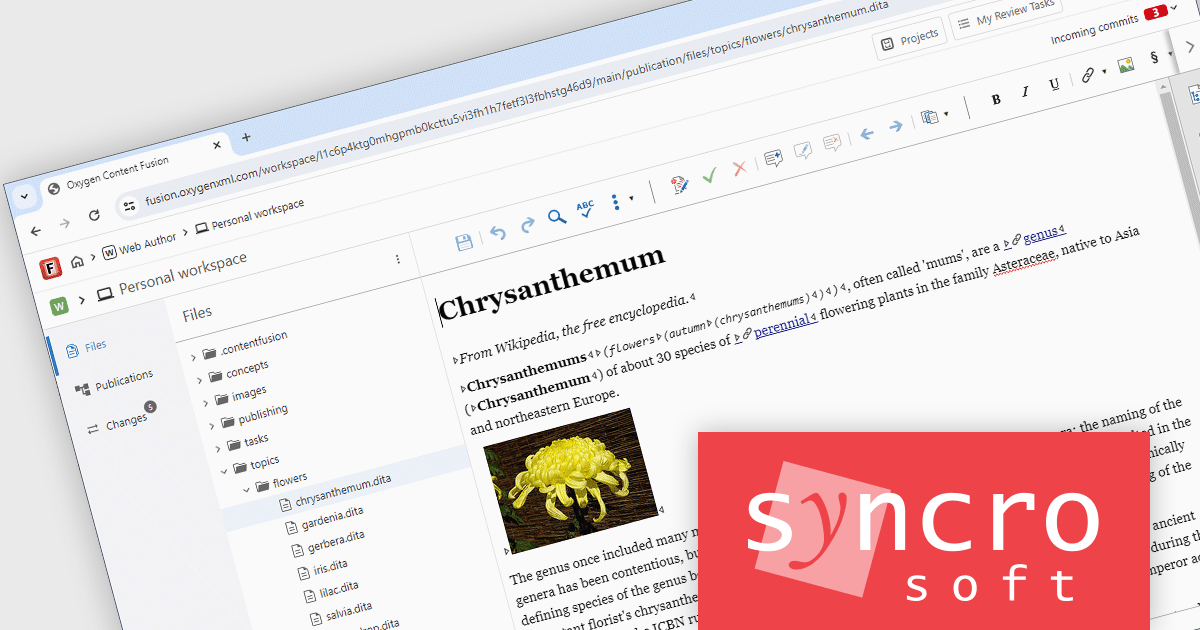
Oxygen Content Fusion by Syncro Soft is a cloud-based collaboration platform for managing and publishing DITA documentation. It allows authors, reviewers, and publishers to work together on the same content in real time, and to track changes and feedback throughout the documentation process. Oxygen Content Fusion also provides a variety of tools for generating and publishing DITA content in a variety of formats, including WebHelp, PDF, and EPUB.
The Oxygen Content Fusion V7.0 update adds a new authoring workspace feature, allowing users to make changes across multiple files within a project and then commit them to the project's default branch. This new feature also enables users to preview their workspace changes prior to committing using a dedicated Changes view. They can also use this view to discard any particular modifications that they do not want to keep, or to start from scratch.
To see a full list of what's new in 7.0, see our release notes.
Oxygen Content Fusion is licensed per user and is available as an Annual license with 1 year support and maintenance. See our Oxygen Content Fusion licensing page for full details.
Learn more on our Oxygen Content Fusion product page.
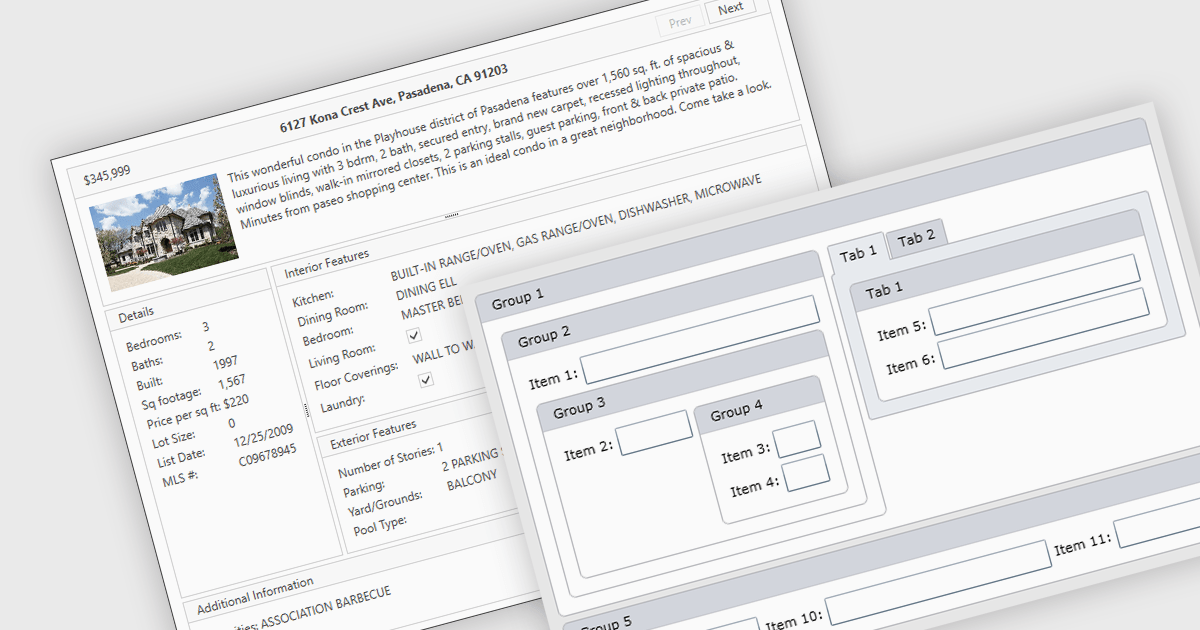
Layout components are reusable building blocks that define the structure and arrangement of content within a user interface. They encapsulate layout logic such as grid systems, promoting code reusability, consistency, and maintainability. By abstracting layout, these components enhance development efficiency and improve the overall design cohesion of an application.
Several WPF UI suites offer layout components including:
For an in-depth analysis of features and price, visit our WPF UI suites comparison.
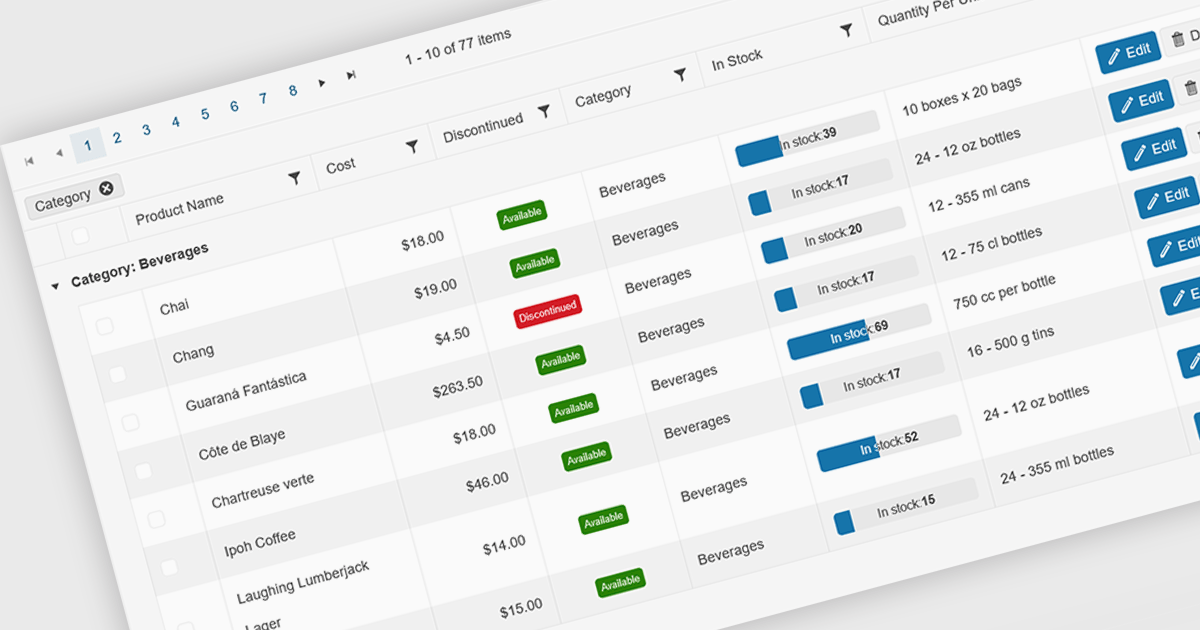
Grid paging is a user interface technique that divides large datasets into smaller, manageable pages within a grid or table. This significantly enhances performance by reducing the amount of data processed and displayed at once, improving load times and responsiveness, particularly when dealing with extensive datasets. Paging also enhances user experience by providing a clear structure for navigating through information, helping to prevent the user from being overwhelmed with excessive data.
Several Blazor grid controls offer paging support including:
For an in-depth analysis of features and price, visit our Blazor grid controls comparison.
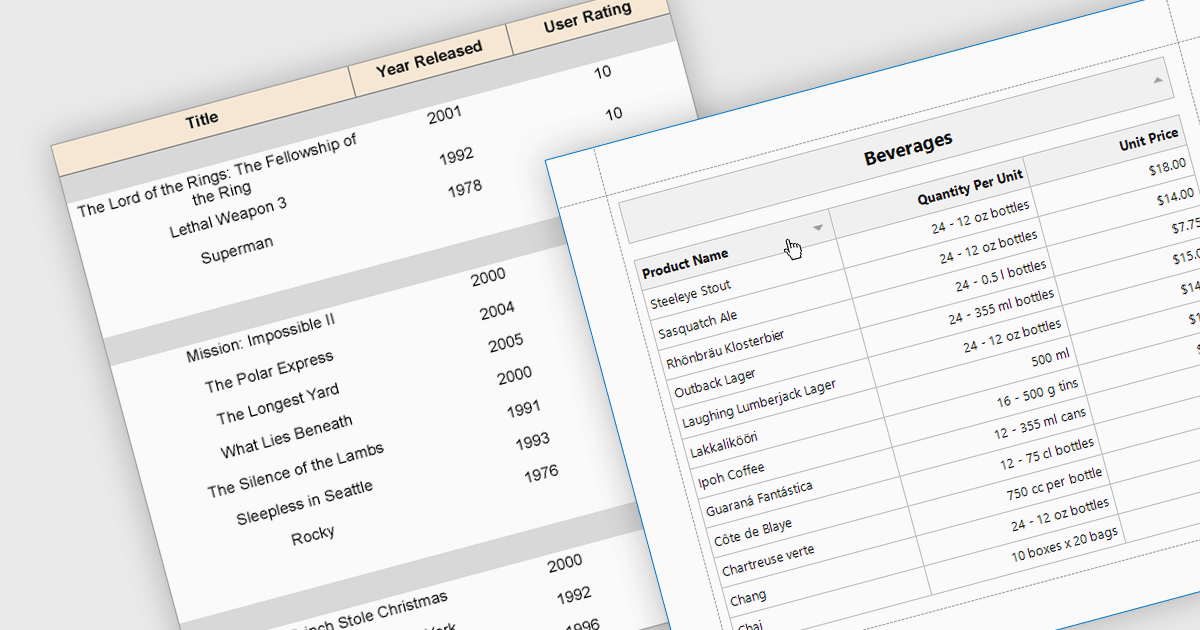
Effective reporting components benefit greatly from robust sorting functionality. This allows users to quickly organize data by any relevant column, facilitating identification of trends, outliers, and specific values. Sorting is particularly valuable for large datasets, enabling users to prioritize high-value information and tailor reports to their specific needs. This improves data exploration efficiency and user satisfaction within the reporting tool.
Several WPF reporting components support data sorting, including:
For an in-depth analysis of features and price, visit our WPF reporting components comparison.
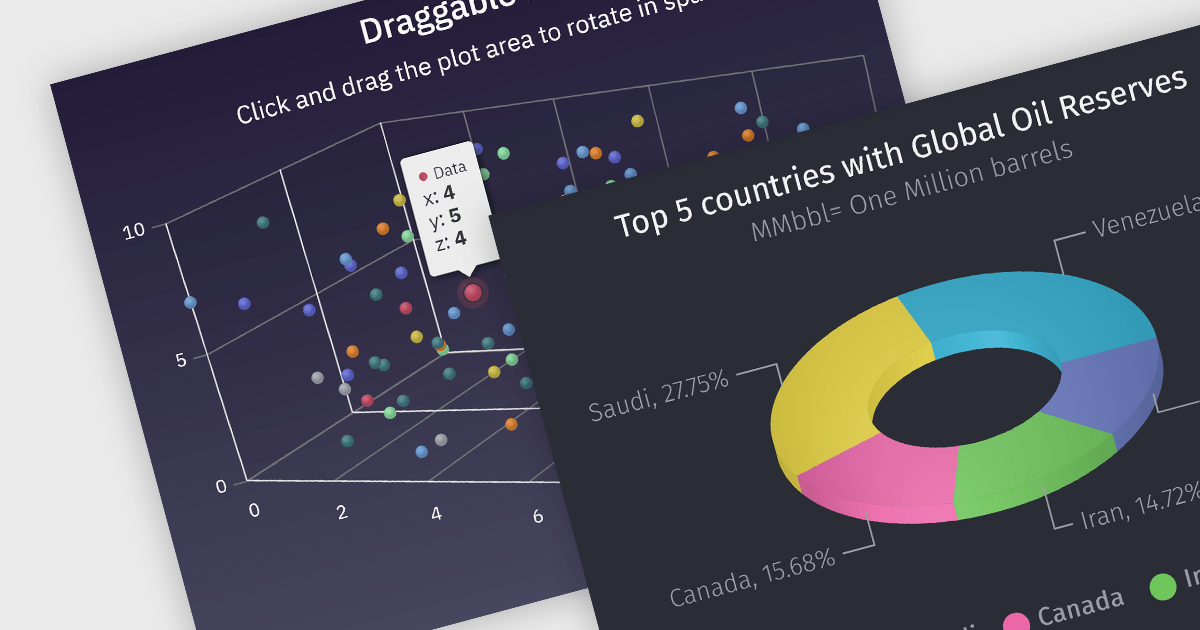
3D charts allow data visualization with depth along a third axis. This capability goes beyond traditional 2D charts, offering a more immersive and informative view. 3D charts are particularly beneficial for complex datasets with multiple variables, as they can reveal patterns and relationships that might be obscured in a flat format. Use cases include showcasing product sales across regions and demographics, visualizing financial trends over time, or depicting scientific data with multiple dimensions.
Several Angular chart controls offer 3D charts including:
For an in-depth analysis of features and price, visit our comparison of Angular chart controls.
Tel: (888) 850 9911
Fax: +1 770 250 6199


