


Proveedor oficial
Como distribuidores oficiales y autorizados, le suministramos licencias legítimas directamente de más de 200 editores de software.
Ver todas nuestras marcas.
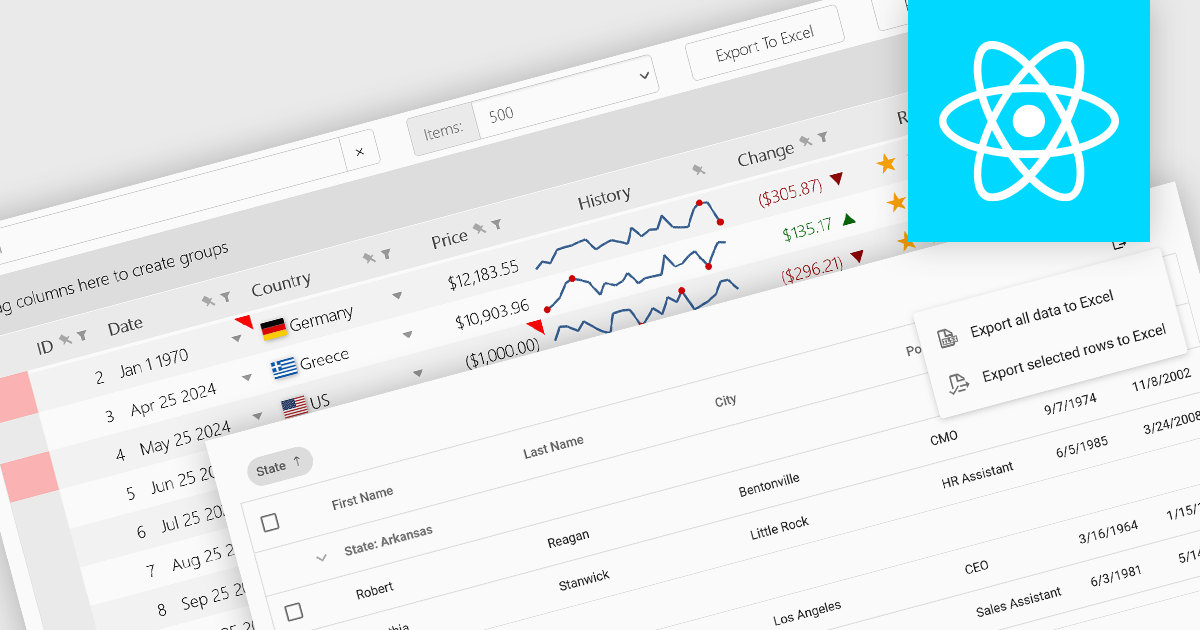
Grid controls with support for exporting to Excel offer users a portable and widely compatible format ideal for offline access, advanced analysis, and custom reporting. Excel’s powerful capabilities, including pivot tables, formulas, and charting tools, allow users to perform sophisticated tasks that go beyond the grid’s native functionality. Additionally, this feature facilitates seamless integration with other workflows and systems, supporting record-keeping, collaboration, and compliance requirements. By enabling greater flexibility and productivity, Excel export functionality significantly enhances the value and usability of grid applications.
Several React grid controls offer the ability to export grids to Excel including:
For an in-depth analysis of features and price, visit our React grid controls comparison.
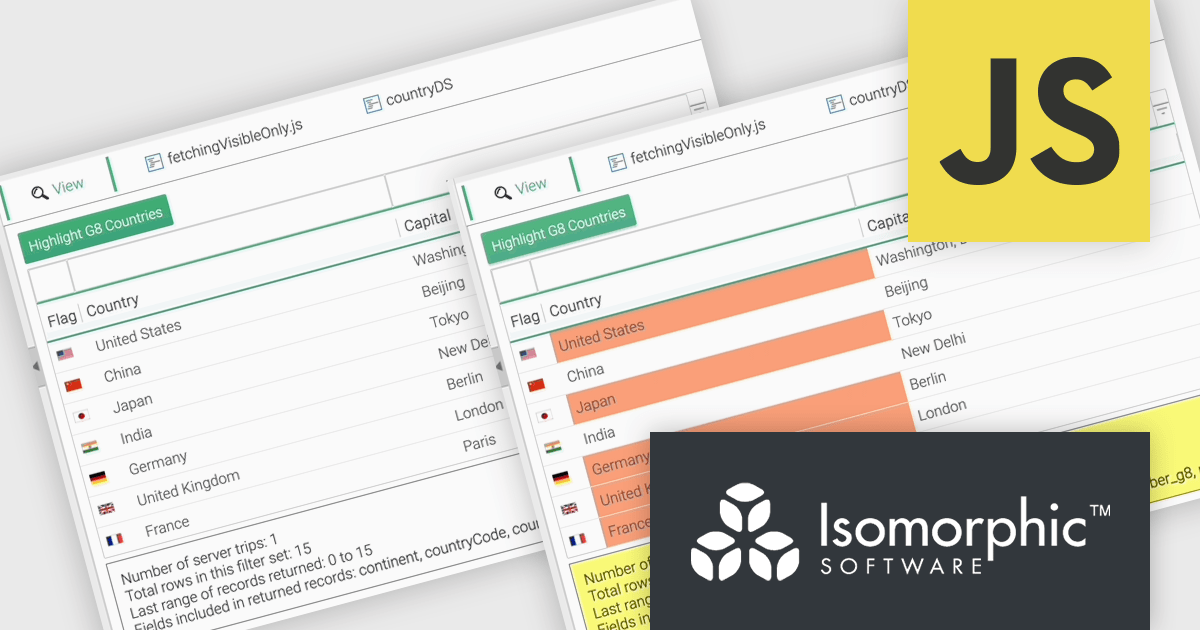
SmartClient is a comprehensive JavaScript component suite compatible with React, Vue, Angular, and more, that empowers you to craft large-scale, high-productivity Enterprise web applications. It provides a comprehensive set of tools for developers, including advanced UI components, robust data management capabilities, and seamless integration with modern backend technologies. Key features include dynamic data fetching, customizable grids, and a responsive interface for a wide range of devices. SmartClient enables developers to create applications with optimized performance, scalability, and a superior user experience. Ideal for enterprise-grade use cases, such as financial analytics, inventory management, and real-time reporting, SmartClient empowers organizations to deliver feature-rich applications that handle complex data requirements with ease.
The SmartClient 13.1 update introduces the Fetch Only Needed Data feature, enabling developers to optimize performance in data-intensive applications by dynamically retrieving only the fields required at a given moment. This targeted data retrieval reduces unnecessary data transfers, minimizes backend load, and enhances responsiveness. Developers can configure grids to fetch additional fields on demand, ensuring efficient resource usage while maintaining flexibility to adapt to dynamic application requirements. By integrating this feature, applications can scale effectively, provide a smoother user experience, and meet the demands of high-performance environments.
To see a full list of what’s new in version 13.1, see our release notes.
SmartClient is licensed per developer and is available as both perpetual and subscription licenses. Product updates and technical support is also available. See our SmartClient licensing page for full details.
For more information, visit our SmartClient product page.
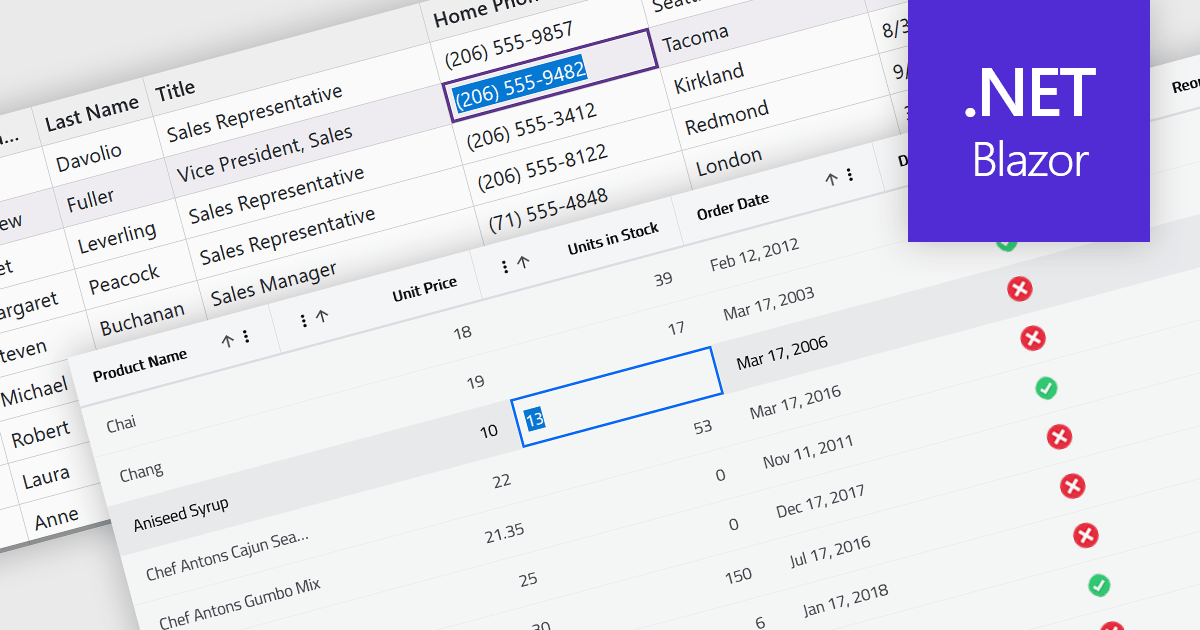
Inline editing in a grid is a user-friendly feature that allows users to edit data directly within the grid interface, without needing to open separate forms or dialogs. This means that data can be modified in place, streamlining workflows by reducing the steps required to make updates. Inline editing is particularly beneficial in scenarios where users need to quickly edit multiple records, such as updating inventory quantities, modifying project statuses, or correcting data errors in real time. By providing immediate visual feedback and maintaining the context of the data set, inline editing enhances productivity and minimizes the risk of disruptions. It is commonly used in applications like content management systems, project management tools, and enterprise resource planning (ERP) systems where efficiency and ease of use are critical.
Several Blazor grid controls offer support for inline editing including:
For an in-depth analysis of features and price, visit our Blazor grid controls comparison.
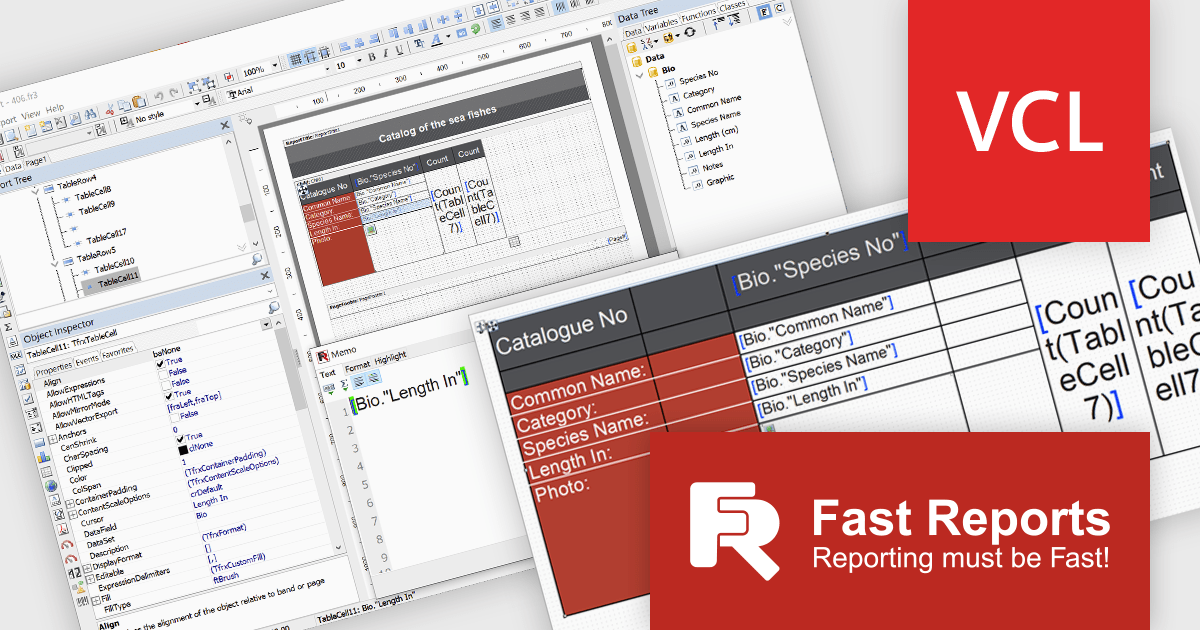
FastReport VCL is a library for creating documents and reports in Embarcadero C++Builder, Delphi, RAD Studio, and Lazarus. It is an add-on component that includes all of the tools needed to create reports, such as a visual report designer, a reporting core, and a preview window, allowing you to add functionality to your application for efficient report generation.
The FastReport VCL v2025.1 release introduces a new Word-style interactive table editor that offers a streamlined, user-friendly approach to designing and editing tables directly within reports. The new editor is particularly valuable for users creating financial reports, invoices, and data-driven documents where clarity and visual appeal are essential. By simplifying the table creation process, it reduces design time, enhances readability, and ensures consistency across reports, making it an ideal tool for professionals who need efficient, high-quality reporting.
To see a full list of what's new in v2025.1, see our release notes.
FastReport VCL is licensed per named user and is available as a Perpetual license with 1 year of technical support and product updates. See our FastReport VCL licensing page for full details.
For more information, see our FastReport VCL product page.
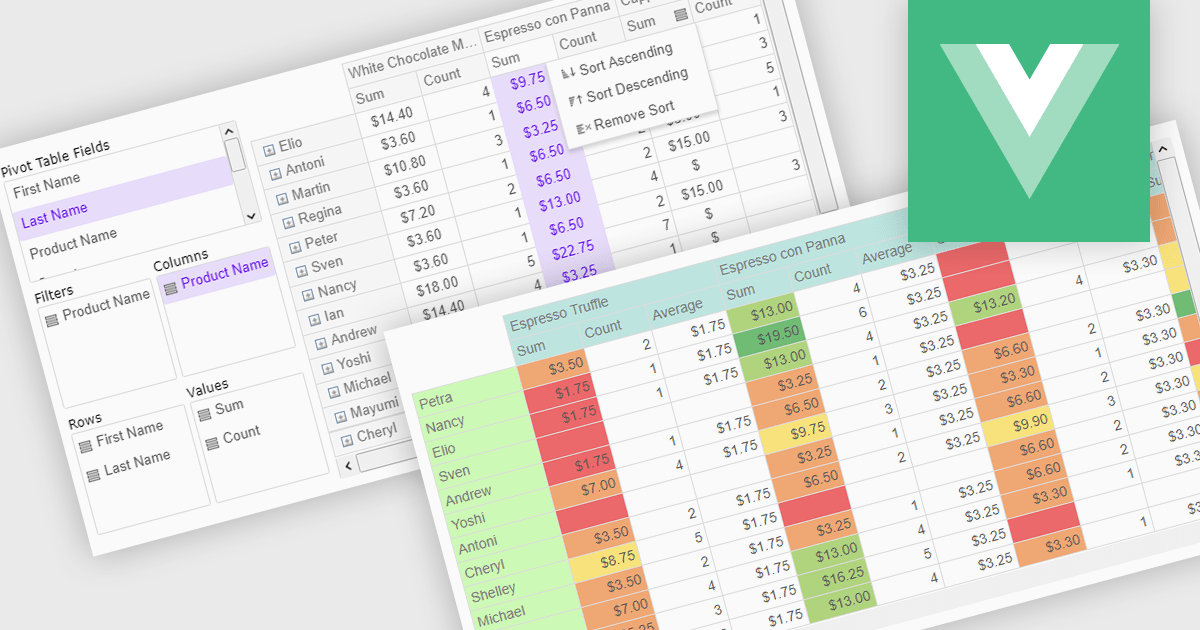
Pivot grids or tables are dynamic tools that allow users to organize and analyze large datasets interactively by allowing them to group, filter, and summarize data across multiple dimensions. This functionality makes it easier to spot patterns and insights, supporting faster decision-making and data processing. Common use cases include help to identify trends in product performance or customer demographics, or financial applications, where users can analyze and forecast expense patterns. Pivot grids empower users with an adaptable and user-friendly interface, offering both high-level overviews and detailed insights with minimal effort.
Several Vue.js UI suites offer pivot grid components including:
For an in-depth analysis of features and price, visit our comparison of Vue.js UI suites.
Tel: (888) 850 9911
Fax: +1 770 250 6199


