


Proveedor oficial
Como distribuidores oficiales y autorizados, le suministramos licencias legítimas directamente de más de 200 editores de software.
Ver todas nuestras marcas.

Syncfusion Essential Studio .NET MAUI, available as part of Syncfusion Essential Studio Enterprise, empowers developers with a comprehensive suite of native UI controls, data visualization tools, and performance optimizations for building modern, cross-platform mobile and desktop applications. This professional-grade toolkit leverages the power of C# and XAML, enabling rapid development of stunning and responsive experiences across diverse platforms.
The Syncfusion Essential Studio .NET MAUI 2024 Volume 2 SP1 (26.2.4) release improves the SfDataGrid by adding localization and support for applying formatting in a column with different cultures. This capability enables developers to create globally accessible and culturally sensitive applications by tailoring grid content and numerical displays to specific cultures, improving user experience and data interpretation accuracy across diverse user bases.
To see a full list of what's new in 2024 Volume 2 SP1 (26.2.4), see our release notes.
Syncfusion Essential Studio .NET MAUI is available as part of Syncfusion Essential Studio Enterprise which is licensed per developer starting with a Team License of up to five developers. It is available as a 12 Month Timed Subscription License which includes support and maintenance. See our Syncfusion Essential Studio Enterprise licensing page for full details.
Learn more on our Syncfusion Essential Studio .NET MAUI product page.

In datagrids, tooltips are on-demand informational popups that appear when hovering over a cell. They provide critical context for truncated content, enhancing usability by allowing users to view the full data point without sacrificing grid layout or requiring them to navigate elsewhere. This improves data comprehension and reduces the need for scrolling or resizing columns, leading to a more efficient user experience.
Several jQuery grid controls offer support for tooltips including:
For an in-depth analysis of features and price, visit our jQuery grid controls comparison.
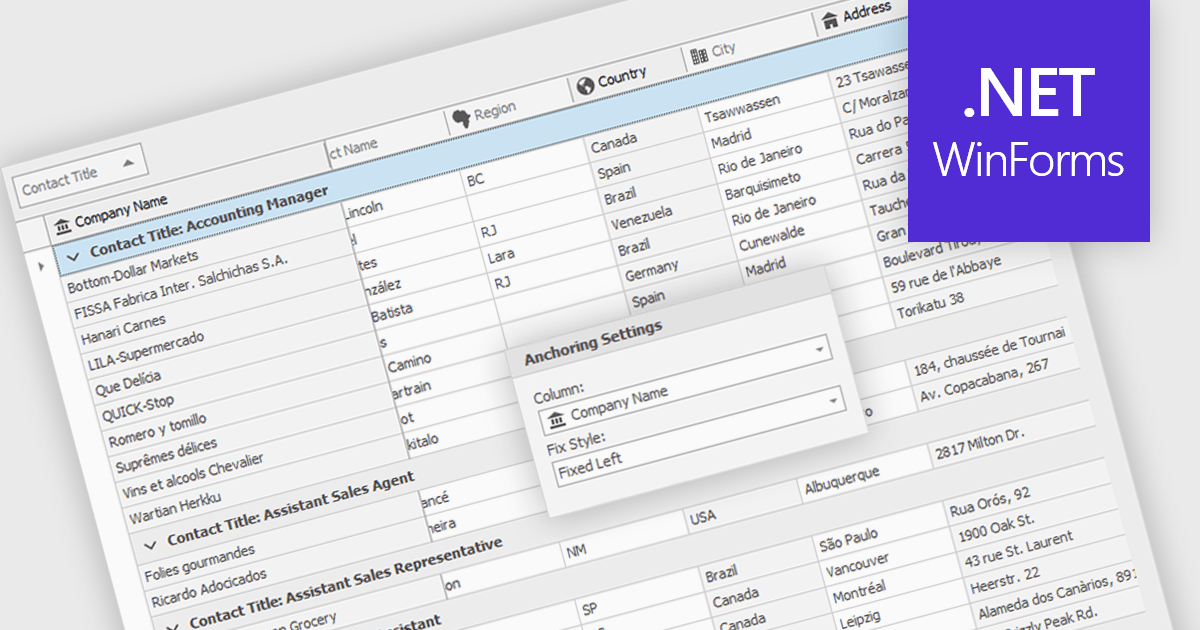
Freezing columns allows specific grid columns to remain visible on the screen while the user scrolls horizontally across the rest of the data. This functionality is beneficial for software developers because it improves user experience by ensuring important reference information, like row identifiers or column headers, stays constantly in view regardless of the data set's width. This can significantly aid in data comprehension and navigation for users working with large datasets.
Several WinForms grid components allow you to freeze columns, including:
For an in-depth analysis of features and price, visit our WinForms grid components comparison.
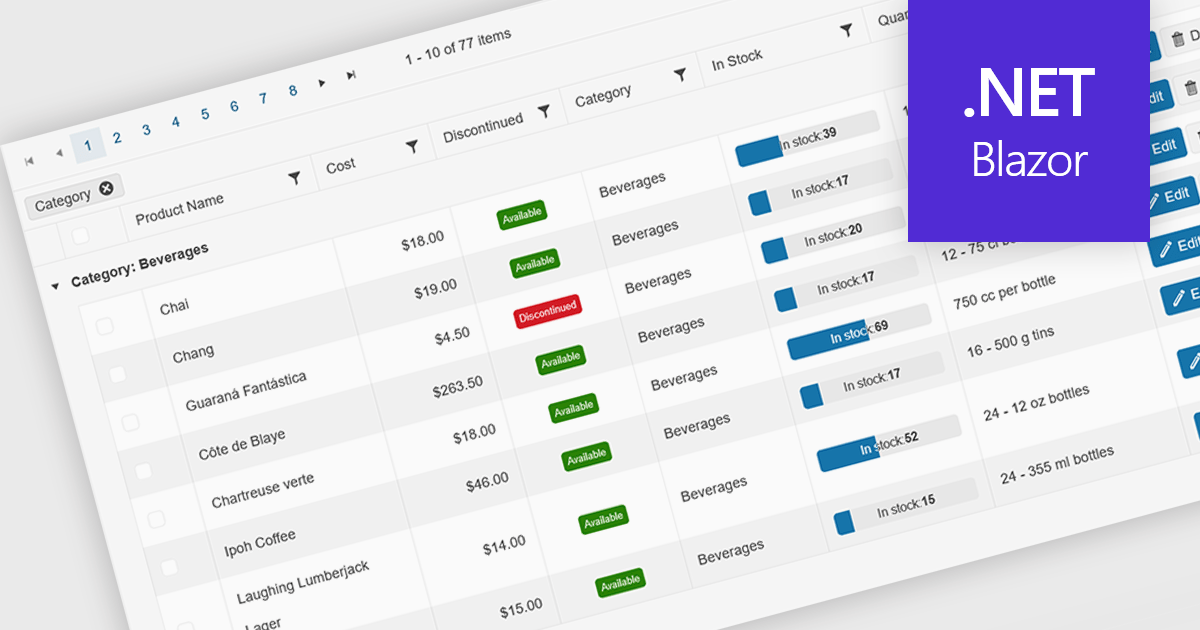
Grid paging is a user interface technique that divides large datasets into smaller, manageable pages within a grid or table. This significantly enhances performance by reducing the amount of data processed and displayed at once, improving load times and responsiveness, particularly when dealing with extensive datasets. Paging also enhances user experience by providing a clear structure for navigating through information, helping to prevent the user from being overwhelmed with excessive data.
Several Blazor grid controls offer paging support including:
For an in-depth analysis of features and price, visit our Blazor grid controls comparison.
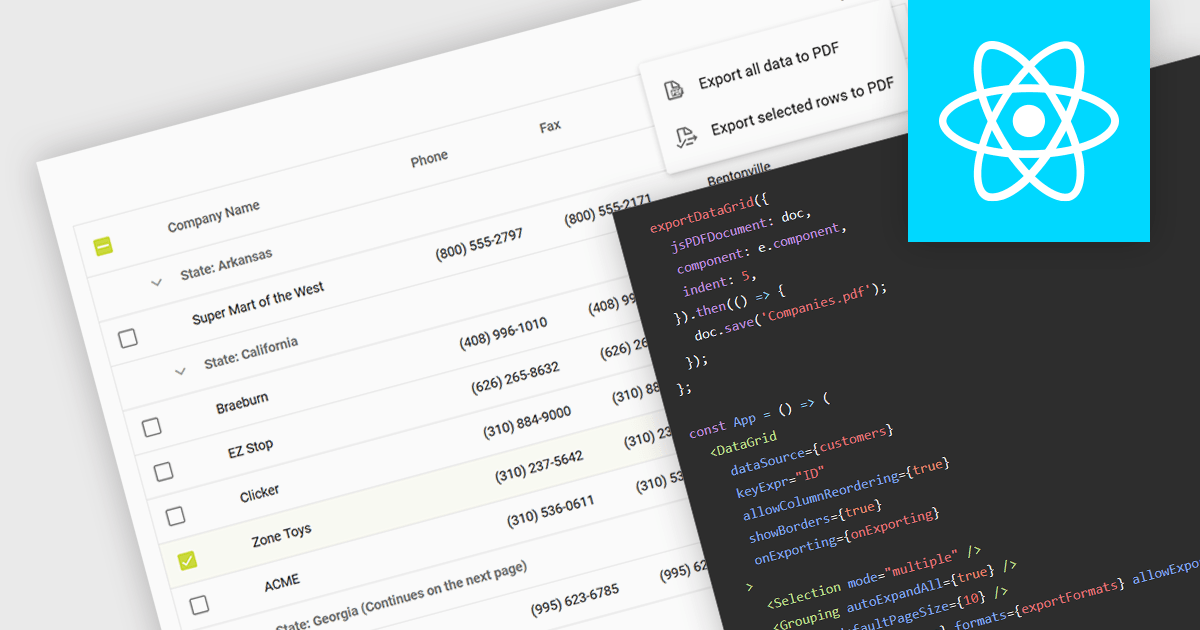
Exporting a data grid to PDF captures the grid layout, including columns, rows, and formatting, and transforms it into a universally accessible and easily shareable document. The export creates a static file, retaining the original grid layout and formatting, that can be easily distributed and viewed consistently across different platforms and on any device with a PDF reader. Additionally, PDFs provide a secure format for preserving data integrity and can be protected against unauthorized editing, making them ideal for official documentation and archiving purposes. This functionality enhances collaboration and data dissemination efficiency by simplifying the sharing and printing processes while maintaining the original data structure and presentation.
Several React grid components allow you to export to PDF, including:
For an in-depth analysis of features and price, visit our comparison of React grid components.
Tel: (888) 850 9911
Fax: +1 770 250 6199


