Noticias sobre Grids

Mejore la legibilidad de conjuntos de datos amplios

Junio 10, 2024
ComponentOne Studio WinForms 2024 v1 presenta una nueva vista denominada Transposed View en FlexGrid for .NET 8 que permite invertir filas y columnas.

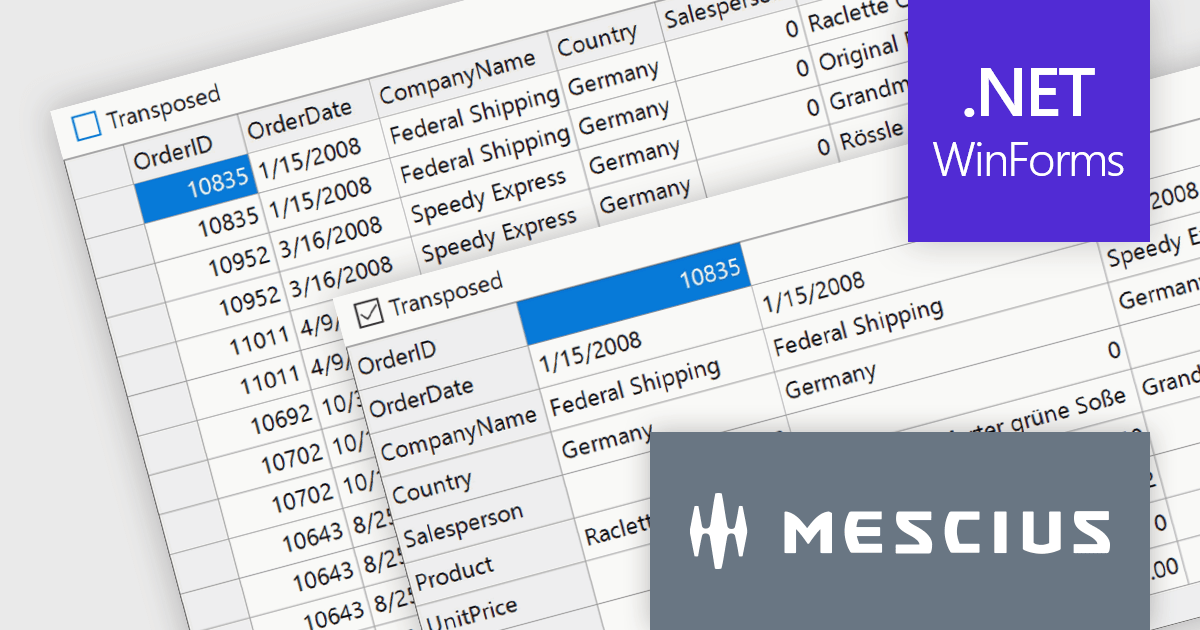
ComponentOne Studio WinForms by MESCIUS is a comprehensive toolkit offering over 120 advanced UI components to streamline Windows Forms application development. It empowers you to build visually appealing and feature-rich applications with functionalities like data visualization through charts and reports, intuitive data editing with performant grids, and modern UI elements including ribbons and docking for a user-friendly experience.

The ComponentOne Studio WinForms 2024 v1 update introduces a new Transposed datagrid view for FlexGrid, enhancing its data presentation capabilities. This feature allows you to display data with rows as columns and columns as rows, providing an alternative view for scenarios where you have many columns or want to prioritize specific data points. This can improve data readability and analysis, especially for wide datasets or when focusing on specific attributes across multiple records.

To see a full list of what's new in 2024 v1, see our release notes.

ComponentOne Studio WinForms is licensed per developer on a perpetual basis and includes a 12 month subscription. See our ComponentOne Studio WinForms licensing page for full details.

Learn more on our ComponentOne Studio WinForms product page.

Optimice las interfaces de entrada de datos en aplicaciones JavaScript

Junio 7, 2024
Use editores emergentes en controles de cuadrícula de JavaScript para mejorar la experiencia de edición de datos de los usuarios mediante la reducción del desorden y las distracciones en la cuadrícula.

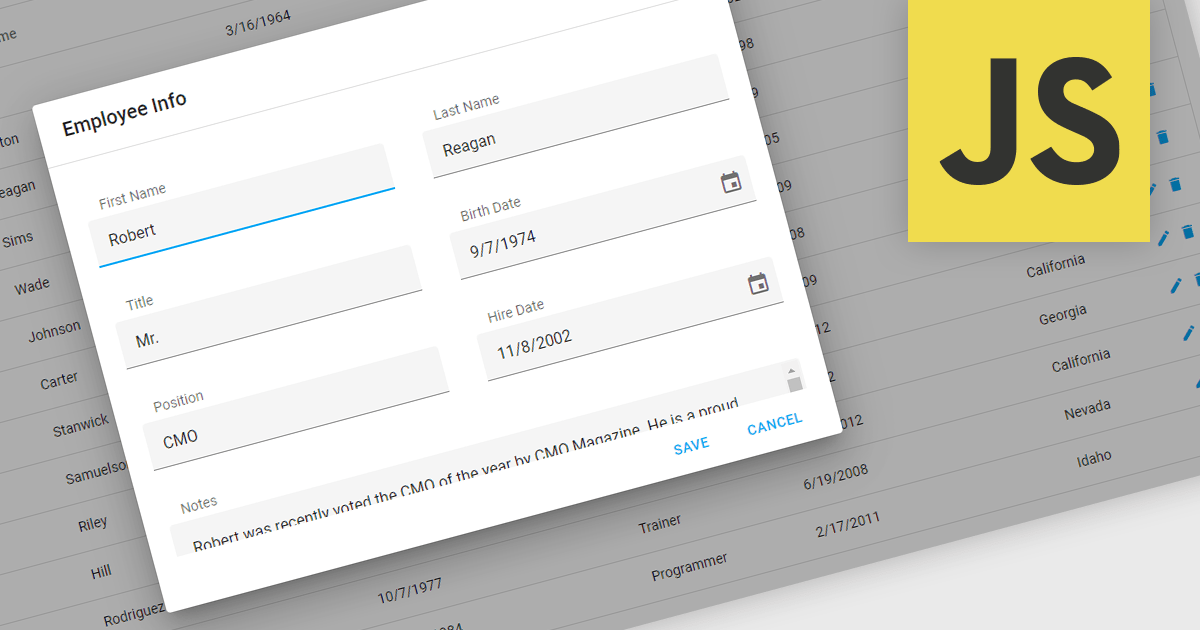
Popup Editors are a common user interface paradigm for editing data within JavaScript grid components. They provide a modal window that appears on top of the grid, containing dedicated input fields for modifying a specific cell or row. This approach enhances data manipulation by offering a focused editing environment with ample space for complex editors or detailed information, improving usability and reducing the risk of errors during data entry.

Many JavaScript grid controls offer popup editors including:

  • DevExtreme React Data Grid (part of DevExtreme Complete by DevExpress) lets you edit data within a grid using a customizable popup editor for efficient data management.
  • Wijmo FlexGrid (part of Wijmo by MESCIUS) allows you to interact with data using a flexible popup editor, enhancing user experience and productivity.
  • Kendo UI for jQuery Grid (part of Kendo UI by Telerik) facilitates seamless data editing through a robust popup editor, ensuring streamlined and intuitive data manipulation.
  • Sencha Ext JS Grid (part of Sencha Ext JS) enables dynamic data entry with a powerful popup editor, improving the efficiency of your web applications.

For an in-depth analysis of features and price, visit our comparison of JavaScript Grid Controls.

Compare JavaScript Grid Controls

Mejore la calidad de entrada con validación de datos

Mayo 31, 2024
Los controles de cuadrícula con soporte de validación garantizan que los datos sean precisos, lo que reduce el riesgo de errores o incoherencias y mejora la experiencia del usuario.

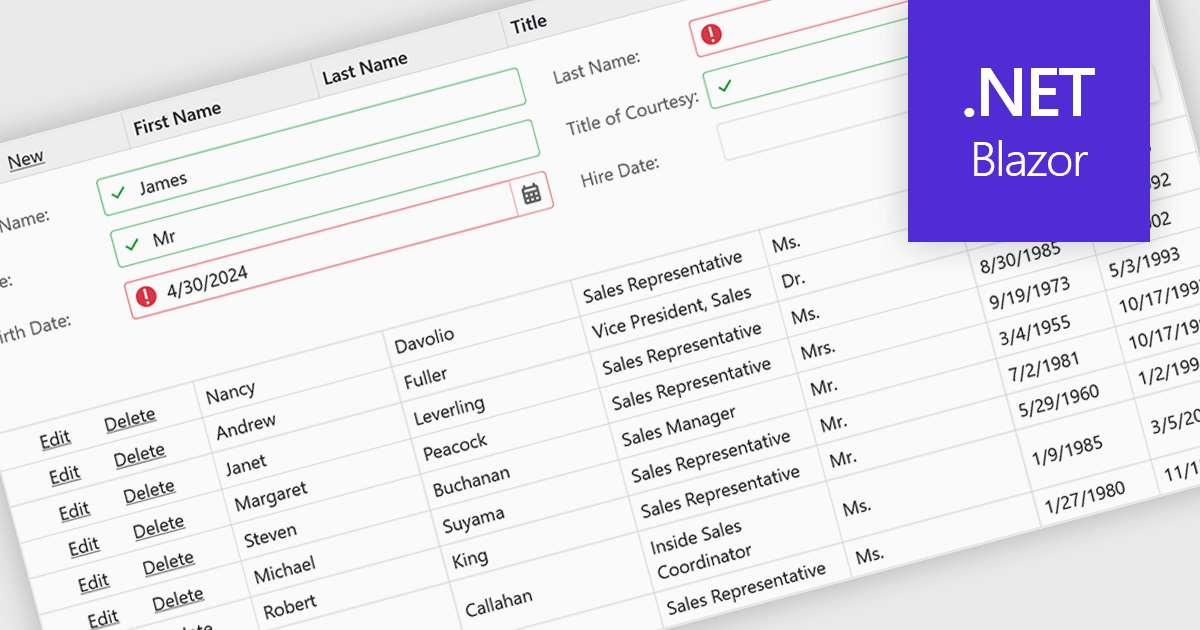
Data validation ensures the accuracy and integrity of information entered by users. It involves implementing rules to verify data against specific criteria, such as data type, format, or range. This helps prevent errors during data entry, improves data consistency, and safeguards against invalid information skewing analysis or downstream processes. Data validation is crucial in various scenarios, including managing financial records, maintaining customer databases, and ensuring data quality for scientific research.

Several Blazor grid controls offer data validation support including:

  • DevExpress Blazor Data Grid (part of DevExpress ASP.NET and Blazor) empowers you to define custom validation rules for individual cells or entire columns.
  • Telerik UI for Blazor Grid (part of Telerik UI for Blazor) ensures data integrity through built-in editors with real-time validation feedback.
  • FlexGrid for Blazor (part of ComponentOne Studio Blazor Edition by MESCIUS) offers a comprehensive validation API for enforcing data type and format restrictions.
  • Syncfusion Blazor DataGrid (part of Syncfusion Essential Studio Enterprise) facilitates data accuracy with customizable validation rules and inline error messages.

For an in-depth analysis of features and price, visit our Blazor Grid controls comparison.

Compare Blazor Grid Controls

Simplifique la exploración de datos para centrarse en las tendencias clave

Mayo 31, 2024
Los paquetes de interfaz de usuario de Blazor con controles de cuadrícula dinámica permiten a los usuarios explorar y resumir grandes conjuntos de datos, descubriendo métricas clave y tendencias ocultas.

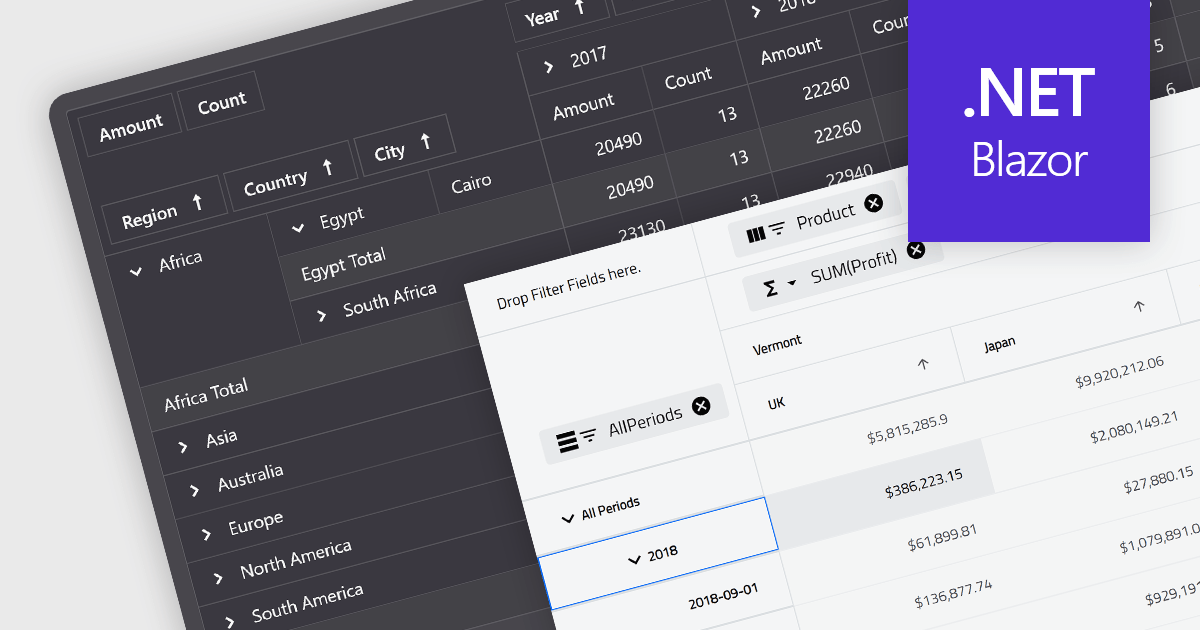
A pivot grid is a powerful data analysis tool that allows you to dynamically summarize and reorganize large datasets. By dragging and dropping fields, you can quickly create a new table that groups and calculates values based on different categories, revealing trends and patterns within your data. This interactive functionality makes pivot grids ideal for gaining insights and informing data-driven decisions. Common use cases include financial analysis, marketing campaign evaluation, and sales performance exploration.

Several Blazor UI suites feature a pivot grid control including:

  • DevExpress ASP.NET and Blazor lets you create interactive pivot grids for Blazor applications, enabling users to analyze data from multiple dimensions.
  • Telerik UI for Blazor enables you to build feature-rich Blazor pivot grids with advanced data analysis capabilities, allowing for in-depth exploration of your data.
  • Infragistics Ignite UI empowers you to deliver Blazor applications with efficient and customizable pivot grids, providing users with a tailored data exploration experience.
  • Syncfusion Essential Studio Enterprise allows you to easily integrate Blazor pivot grids with various data sources and perform complex aggregations.

For an in-depth analysis of features and price, visit our Blazor UI suites comparison.

Compare Blazor UI Suites

Muestre tendencias junto con los datos correspondientes

Mayo 17, 2024
La adición de minigráficos a cuadrículas ayuda a los usuarios a identificar patrones en filas y columnas, lo que permite un análisis rápido y detallado de grandes conjuntos de datos.

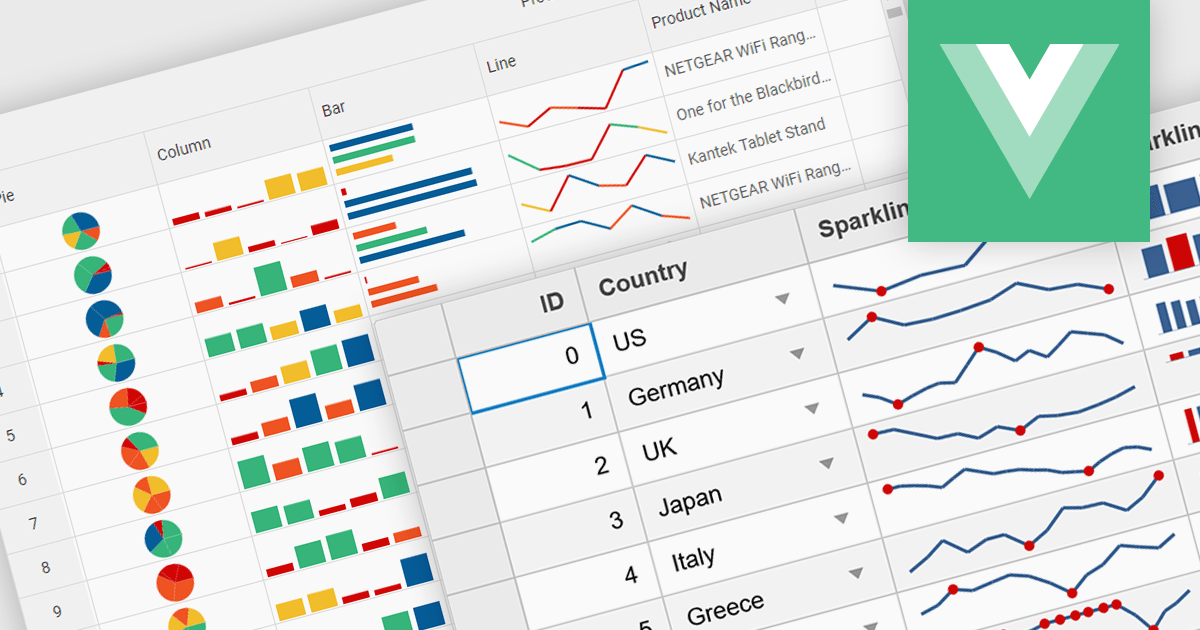
Sparklines are miniature charts embedded directly within grid cells, providing a quick visual summary of data trends within a larger dataset. These tiny line graphs, often lacking axes or detailed labels, condense information into a highly space-efficient format, allowing viewers to grasp patterns and fluctuations at a glance across multiple rows and columns of a grid.

Several Vue.js grid controls offer support for sparklines including:

  • Kendo UI for Vue Grid (part of Kendo UI by Telerik) empowers developers to integrate insightful sparklines within Vue grids, offering a concise view of data trends.
  • Wijmo FlexGrid (part of Wijmo by MESCIUS) facilitates data exploration through sparklines embedded directly in cells, enhancing visual analysis without overwhelming users.
  • Jspreadsheet Pro Data Grid offers a robust data manipulation platform, where sparklines can be incorporated into cells to visually represent data trends.
  • Smart HTML Elements Grid allows developers to seamlessly integrate sparklines into grids, enabling users to gain quick insights from data fluctuations.
  • Syncfusion Grid control for JavaScript (part of Syncfusion Essential Studio Enterprise) lets you leverage sparklines for efficient data pattern recognition within the grid.

For an in-depth analysis of features and price, visit our Vue.js Grid controls comparison.

Compare Vue.js Grid Controls