
MindFusion.Charting for JavaScript
Gráficos interactivos, medidores y paneles escritos en JavaScript puro.
Publicado por MindFusion Group
Distribuido por ComponentSource desde 2003
Precios desde: $ 294.00 Versión: 2.1 Actualizado: Jun 5, 2022
Gráficos interactivos, medidores y paneles escritos en JavaScript puro.
Publicado por MindFusion Group
Distribuido por ComponentSource desde 2003
Precios desde: $ 294.00 Versión: 2.1 Actualizado: Jun 5, 2022

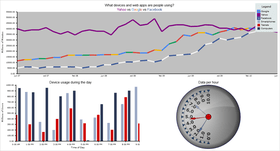
MindFusion.Charting for JavaScript combines 2D and 3D charts, financial graphs, gauges and dashboards. It includes an elegant API, a rich event set, unlimited number and type of data series and everything else you might need to create the perfect data visualization in JavaScript and HTML.


Imagen 1 / 11
MindFusion.Charting for JavaScript Features
MindFusion.Charting for JavaScript también está disponible en:
Chatee en vivo ahora mismo con nuestros especialistas en licencias de MindFusion Group.


Tel: (888) 850 9911
Fax: +1 770 250 6199


