


Fournisseur officiel
Comme nous somme les distributeurs officiels et autorisés, nous vous fournissons des licences légitimes directement à partir de 200+ éditeurs de logiciels.
Voyez toutes nos marques.
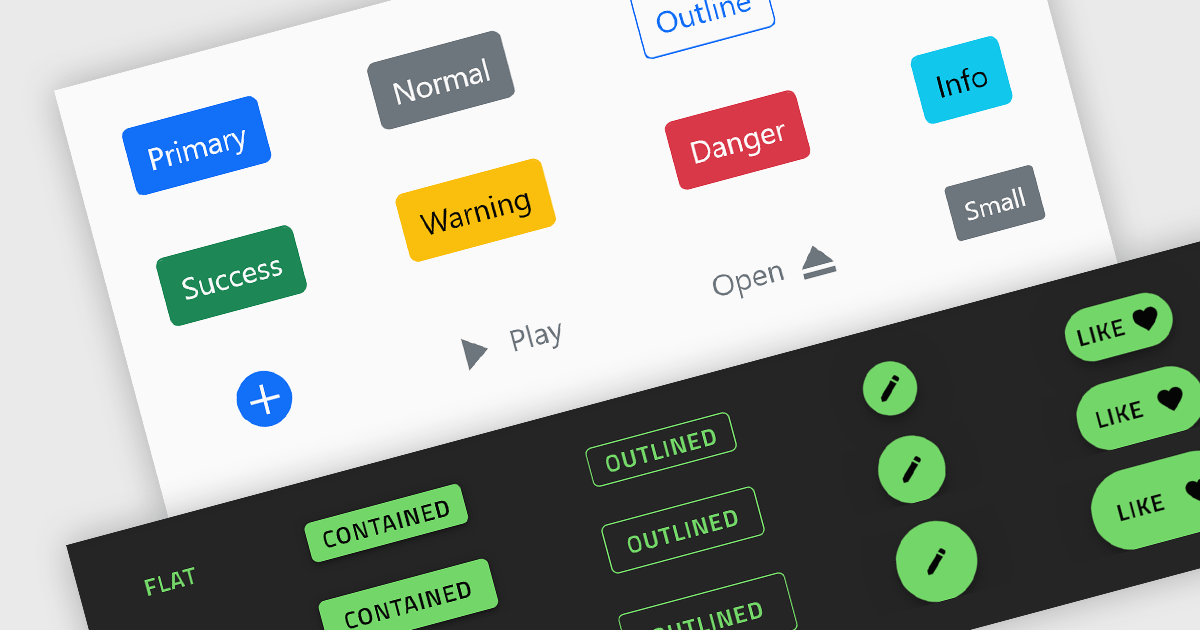
Button controls are specialized tools within design and content management systems that facilitate the creation, customization, and management of buttons. These controls empower users to effortlessly tailor button appearance, size, color, and functionality without requiring coding expertise, streamlining the design process and enhancing user interface consistency across digital platforms.
Several Angular data editor collections offer button editor controls including:
For an in-depth analysis of features and price, visit our Angular Data Editors comparison.
Syncfusion Essential Studio Enterprise provides a comprehensive collection of UI components and frameworks for building modern cross-platform applications. It offers over 1,800 components compatible with .NET WinForms, WPF, ASP.NET Core & MVC, WinUI, MAUI, JavaScript, Xamarin, Blazor, and more, enabling seamless application development across diverse devices and operating systems.
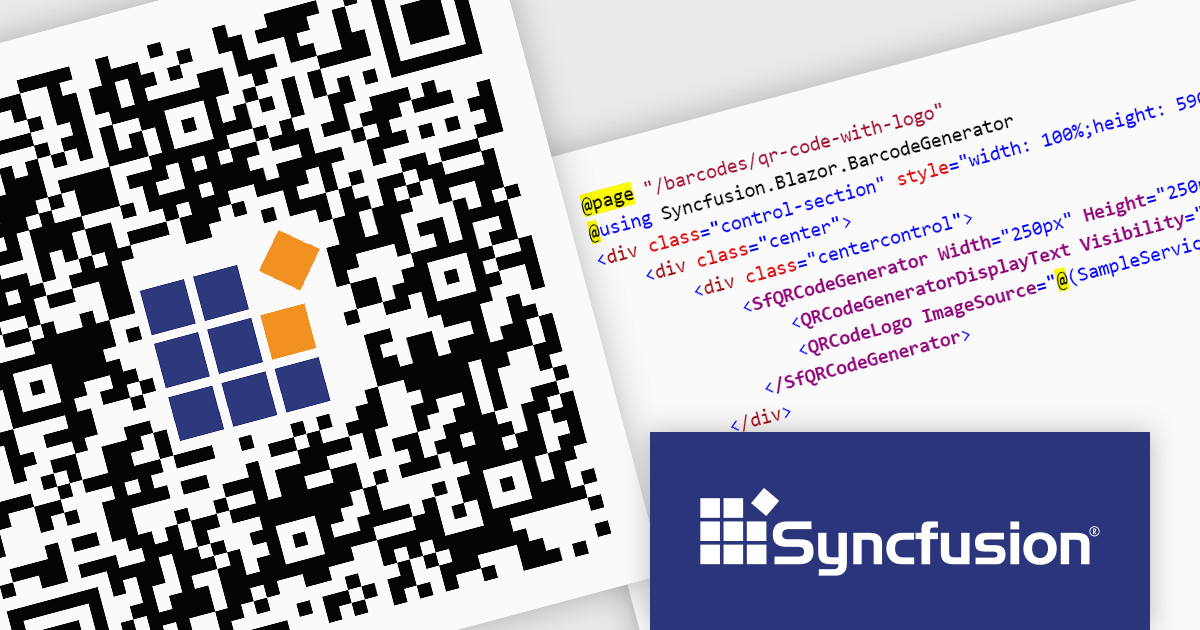
The Syncfusion Essential Studio Enterprise 2024 Volume 2 SP1 (26.2.4) release introduces the ability to embed a custom logo within generated QR codes, empowering businesses to enhance brand recognition and user engagement. By seamlessly integrating company branding into these ubiquitous codes, organizations can create a more distinctive and memorable user experience, fostering stronger brand recall and driving increased interaction with marketing materials and digital content.
To see a full list of what's new in 2024 Volume 2 SP1 (26.2.4), see our release notes for ASP.NET Core, ASP.NET MVC, Blazor, and JavaScript.
Syncfusion Essential Studio ASP.NET Core, ASP.NET MVC, Blazor and JavaScript are available as part of Syncfusion Essential Studio Enterprise which is licensed per developer starting with a Team License of up to five developers. It is available as a 12 Month Timed Subscription License which includes support and maintenance. See our Syncfusion Essential Studio Enterprise licensing page for full details.
Learn more on our ASP.NET Core, ASP.NET MVC, Blazor, and JavaScript product pages.
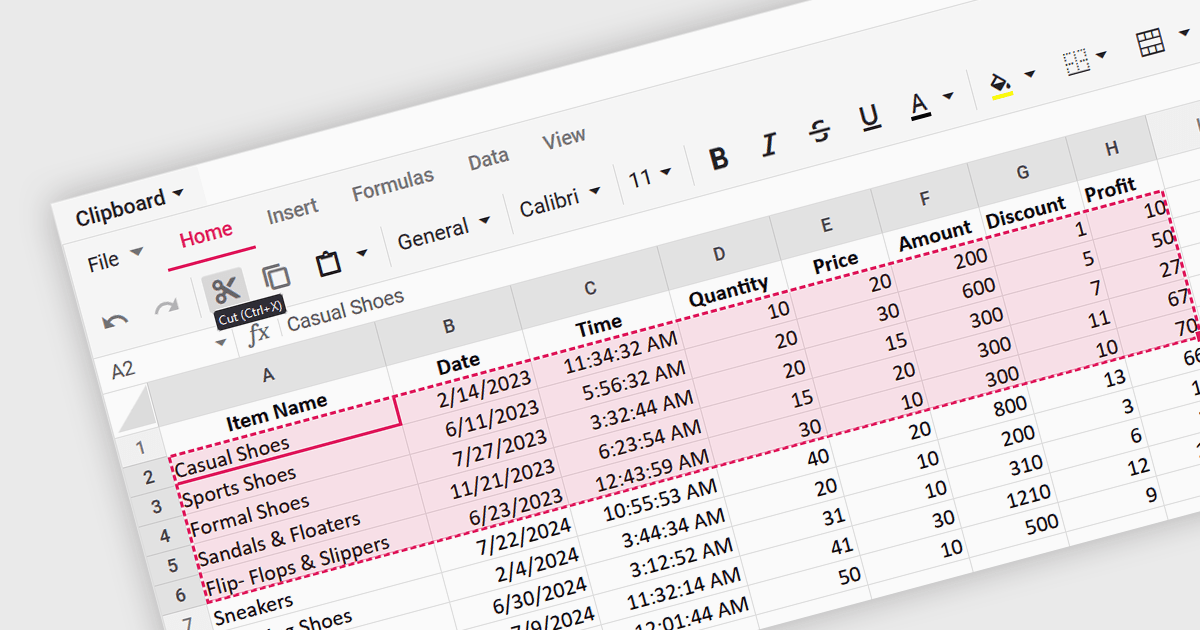
A spreadsheet control that supports clipboard operations gives users the ability to cut, copy and paste data within or between spreadsheets. These functions enable users to efficiently transfer, duplicate, or relocate information by temporarily storing selected cells or ranges in a system-wide clipboard. This functionality forms a key part of a spreadsheet application, saving time and increasing productivity by enabling quick duplication or relocation of data without the need to manually re-enter information. By reducing the risk of errors that might occur during manual data entry or reformatting, these operations help maintain data integrity and streamline data manipulation and management tasks.
Several Angular spreadsheet components support the use of clipboard operations, including:
For an in-depth analysis of features and price, visit our comparison of Angular spreadsheet controls.
Kendo UI by Telerik is a comprehensive suite of JavaScript UI components designed to accelerate web application development. Offering pre-built, customizable elements for grids, charts, schedulers, and more, it streamlines UI creation across popular frameworks like jQuery, Angular, React, and Vue. Key features include responsive design, accessibility, and high performance, enhancing user experience. Developers benefit from reduced development time, consistent UI patterns, and the ability to build feature-rich applications faster.
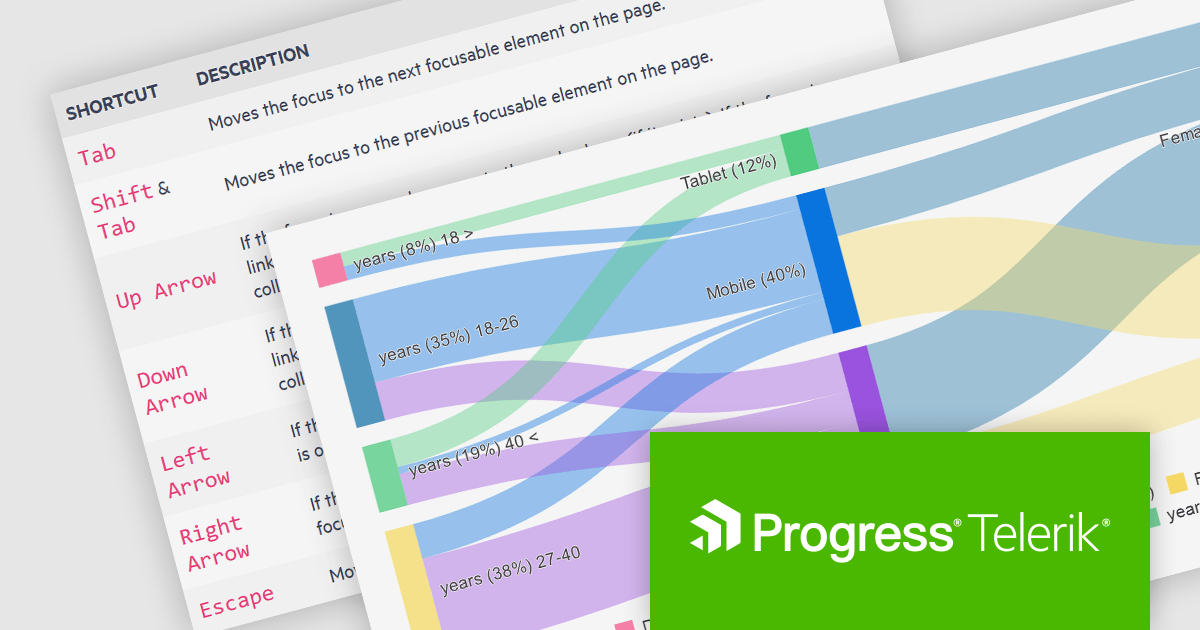
The Kendo UI for Angular v16.5.0 update (part of Kendo UI 2024 Q2) enhances the Sankey Diagram component with support for keyboard navigation and Right-to-Left (RTL) accessibility features. Keyboard navigation allows users to interact with the diagram using only their keyboard, making it more accessible to users with disabilities. RTL support ensures that the component is usable in languages written from right to left, such as Arabic and Hebrew, broadening its applicability and usability in international contexts. These additions collectively enhance the user experience, making the component more versatile and inclusive for a diverse range of users and applications.
To see a full list of what's new in 2024 Q2 (v16.5.0), see our release notes.
Kendo UI is licensed per developer and is available as a perpetual license with a one year support subscription, which is available in three tiers: Lite, Priority or Ultimate. See our Kendo UI licensing page for full details.
Kendo UI is available to buy in the following products:

Wijmo by MESCIUS is a comprehensive JavaScript library offering a suite of high-performance UI components and data grids specifically designed to streamline the development of modern enterprise applications. It emphasizes reduced development time and improved maintainability, along with a focus on performance through its efficient design and small module size. Wijmo integrates seamlessly with popular JavaScript frameworks like Angular, React, and Vue.js, and supports cutting-edge technologies like TypeScript, making it a versatile solution for building complex web applications.
The Wijmo 2024 v1 (Build 5.20241.19) update introduces full support for Angular 18. The latest Angular release prioritizes application performance with several key advancements. Build times are reduced through an enhanced optimizer and differential loading. Streamlined code splitting and lazy loading techniques ensure modules are loaded only when needed. Zoneless change detection, powered by signals, replaces the Zone.js dependency, offering a lighter-weight and more efficient approach to managing state updates. These optimizations combine to deliver faster load times and a smoother user experience. Wijmo’s support for Angular 18 means that it can take advantage of these enhancements, resulting in more performant web apps.
Wijmo is licensed per developer. Developer Licenses are perpetual and include 1 year Subscription which provides upgrades, including bug fixes and new features. See our Wijmo licensing page for full details.
Learn more on our Wijmo product page.


Tél : (888) 850 9911
Fax : +1 770 250 6199


