


Fournisseur officiel
Comme nous somme les distributeurs officiels et autorisés, nous vous fournissons des licences légitimes directement à partir de 200+ éditeurs de logiciels.
Voyez toutes nos marques.
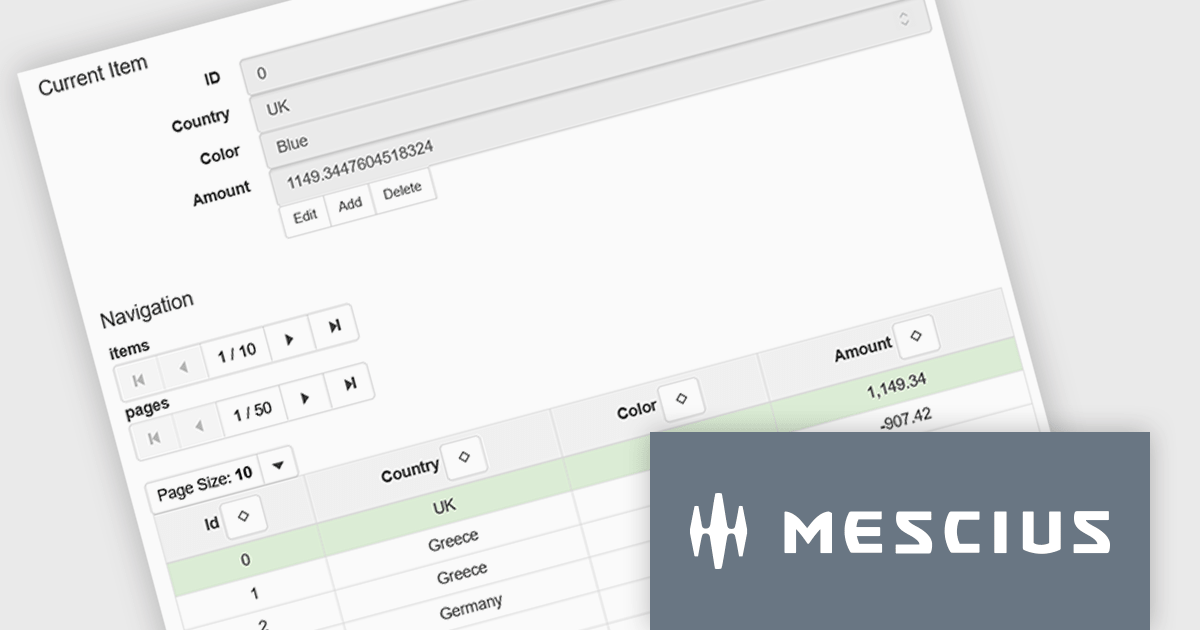
Wijmo is a cutting-edge collection of over 100 high-performance JavaScript UI controls designed for modern enterprise applications. Built for speed and flexibility, Wijmo empowers developers to deliver superior user experiences with fully responsive, touch-friendly, and accessible components. Use Wijmo with any popular JavaScript framework - including Angular, React, Vue, Svelte, or pure JavaScript/TypeScript - for rapid application development across modern web and mobile platforms.
On Wednesday, Nov 5th, at 11:00 AM EST, MESCIUS (formerly GrapeCity) will be presenting a CodeClinic Live Webinar to demonstrate how you can utilize the power and flexibility of the Wijmo CollectionView Class to efficiently handle data in JavaScript applications.
Key highlights include:
Register for the Live Webinar today and mark your calendar for November 5th.
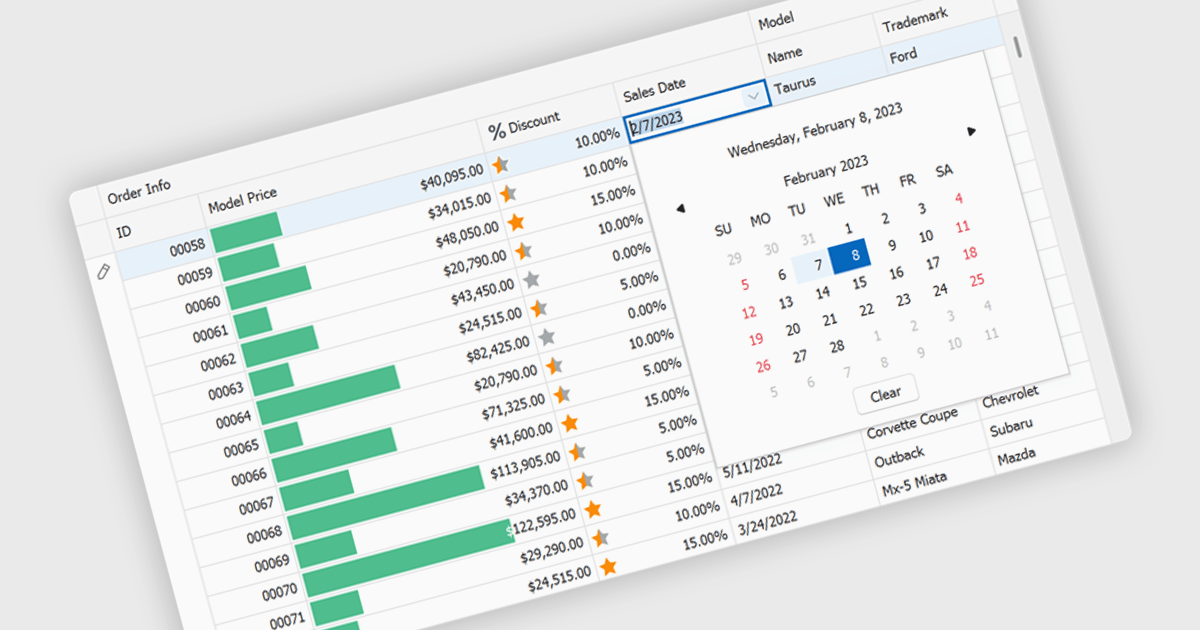
A date editor enables users to easily input, modify, and validate date values through an intuitive interface such as a calendar picker or spinner. This feature ensures consistent date formats across datasets, reduces manual entry errors, and improves overall data integrity. By enforcing validation rules and supporting localization, date editors accommodate a wide range of user needs and regional formats. Common use cases include managing records in applications such as employee databases, scheduling systems, financial reporting tools, and project management dashboards where accurate and consistent date information is essential for reliable data analysis and decision-making.
Several Vue.js data editor collections provide date editors including:
For an in-depth analysis of features and price, visit our Vue.js Data Editors comparison.
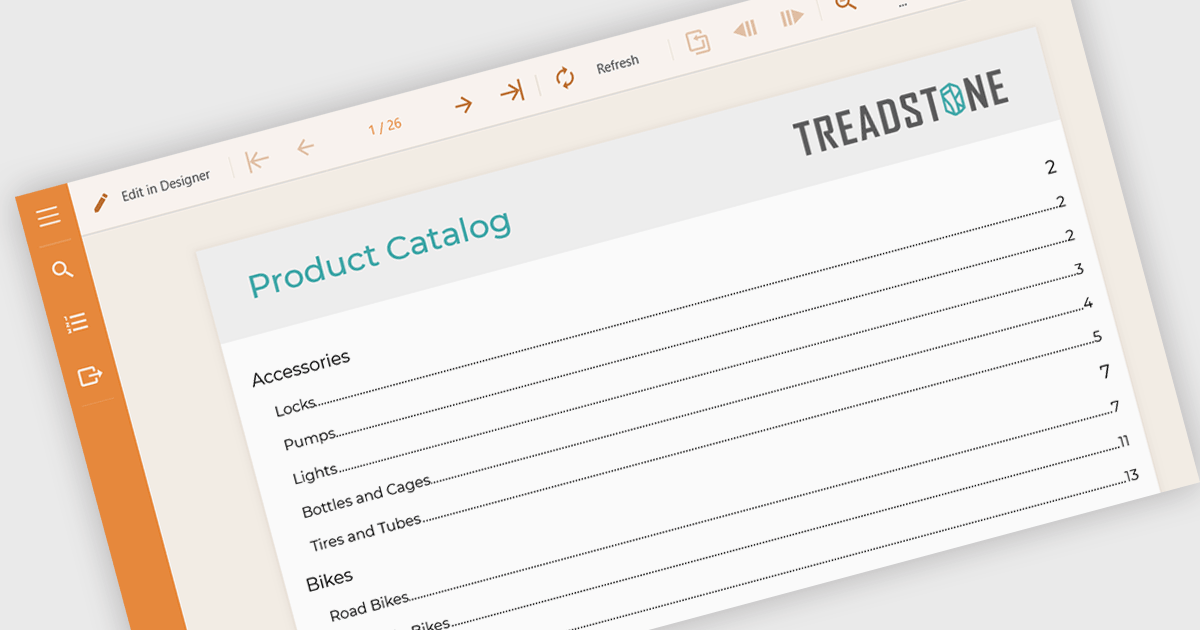
Table of Contents (TOC) support in a reporting component allows developers to automatically generate a structured overview of a report’s sections, typically displayed at the beginning of the document. This feature helps users navigate long or complex reports by providing direct links or page references to key sections, mirroring the layout and hierarchy of the report's content. For developers, it reduces the need to manually maintain navigation aids, improves the report’s usability, and enhances the professional appearance of exported formats like PDF or Word. TOC support is especially beneficial in compliance-heavy or audit-focused applications where clear documentation structure is essential.
Several Angular reporting controls offer Table of Contents (TOC) support including:
For an in-depth analysis of features and price, visit our comparison of Angular reporting controls.
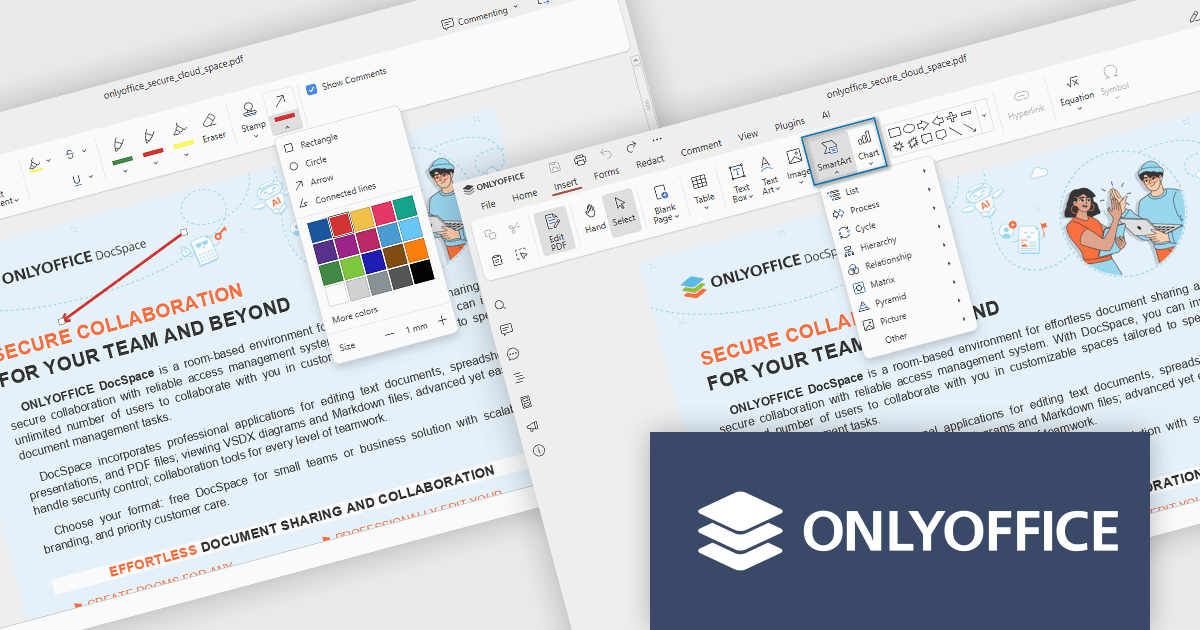
ONLYOFFICE Docs is a comprehensive online editor, allowing users to create text documents, spreadsheets, presentations, and forms. It enables your users to edit, share, and collaborate on documents online in their preferred browser, within your own application. It is fully compatible with OOXML (Office Open XML) formats and supports popular Microsoft Office and other document formats such as CSV, DOC, DOCX, EPUB, HTML, ODP, ODS, ODT, PDF, PPT, PPTX, RTF, TXT, XLS, and XLSX.
The ONLYOFFICE Docs v9.1 update enhances the PDF Editor to provide a more efficient and secure document management experience for developers and teams. It introduces advanced redaction tools that allow precise removal of sensitive information, including the ability to find and redact specific terms or entire pages. The update also expands annotation capabilities with customizable shapes and drawing tools for clearer document markup. Additionally, developers can now embed charts and SmartArt graphics directly within PDFs, enabling better visualization of data and smoother integration of visual elements without leaving the editing environment.
To see a full list of what's new in v9.1.0, see our release notes.
ONLYOFFICE Docs Developer Edition is licensed by the number of simultaneous document connections and is available as an annual license with 1 year support and upgrades. See our ONLYOFFICE Docs Developer Edition licensing page for full details.
For more information, see our ONLYOFFICE Docs Developer Edition product page.

A pop-up editor in a grid provides an efficient and user-friendly way to edit data directly within a grid interface without navigating to a separate page. When a record is selected for editing, a pop-up window appears above the grid, presenting all relevant fields in a clean, structured form. This approach streamlines data management by allowing focused edits while preserving the context of the main dataset. It is particularly beneficial for complex records that contain multiple fields, nested information, or require detailed validation. Common use cases include editing customer records in CRM systems, updating inventory details in product management dashboards, or modifying entries in administrative data grids. By combining convenience, clarity, and control, a pop-up editor enhances both productivity and the overall user experience.
Many React grid controls offer popup editors including:
For an in-depth analysis of features and price, visit our comparison of React Grid Controls.


Tél : (888) 850 9911
Fax : +1 770 250 6199


