


Fournisseur officiel
Comme nous somme les distributeurs officiels et autorisés, nous vous fournissons des licences légitimes directement à partir de 200+ éditeurs de logiciels.
Voyez toutes nos marques.
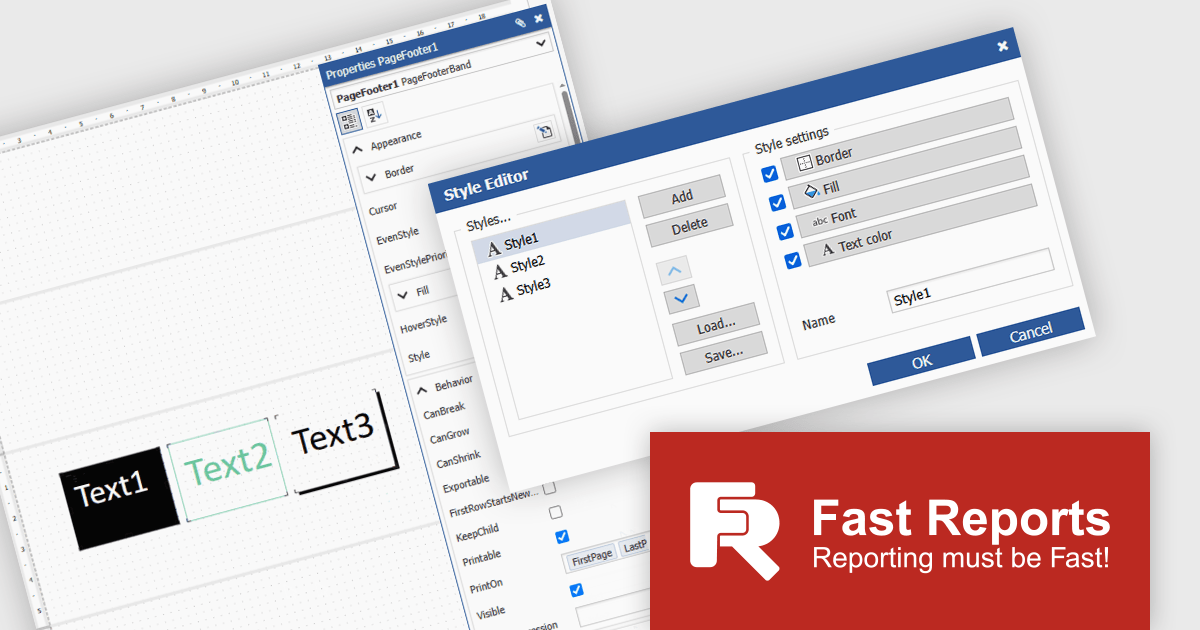
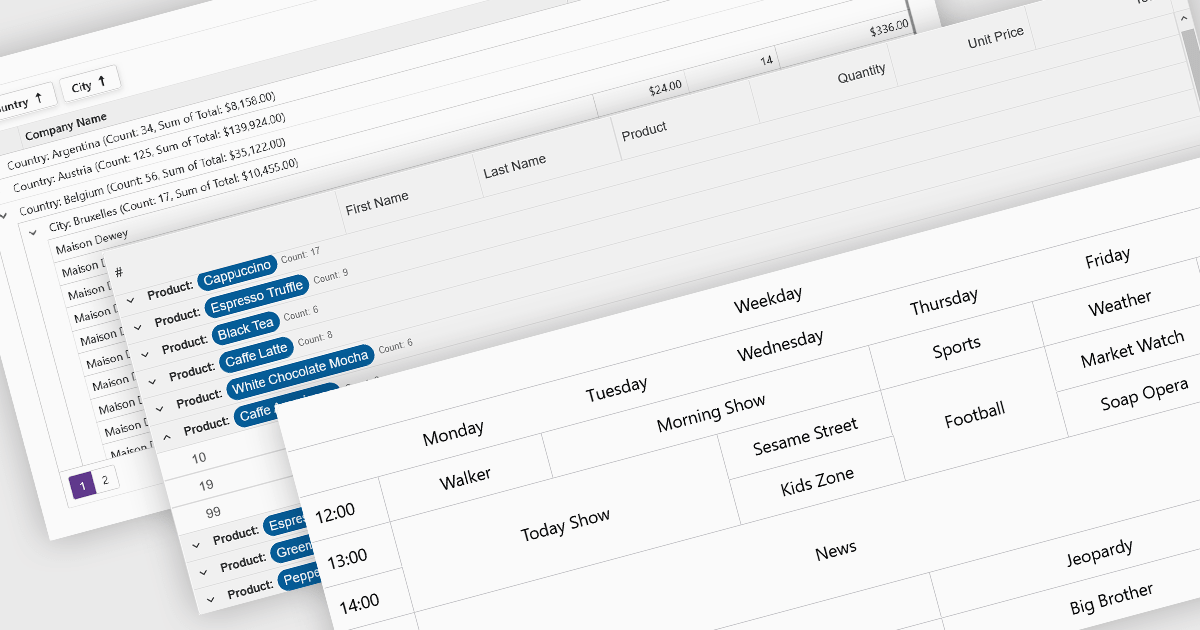
FastReport Online Designer is a cross platform visual report designer for FastReport .NET that enables users to create, edit and view reports on any device running Android, iOS or Windows through a modern web browser on computers, tablets, smartphones, game consoles or TV sets. Common use cases include remote collaboration on operational dashboards, embedding interactive reporting in web applications and empowering business users to customize and share up to date analyses without installing additional software.
FastReport Online Designer 2025.2 introduces a new style editor that enables users to define and manage report styles in one place. By allowing customization of fill colors, fonts, borders, and more, the feature removes the need for repetitive manual formatting. Users can now create a single style and apply it across multiple components, ensuring visual consistency and reducing formatting time.
To see a full list of what's new in v2025.2, see our release notes.
FastReport Online Designer is available as a license option in the FastReport .NET Components Packages. It is included in FastReport Ultimate .NET and FastReport Web .NET. See our FastReport Online Designer licensing page for full details.
For more information, see our FastReport Online Designer product page.
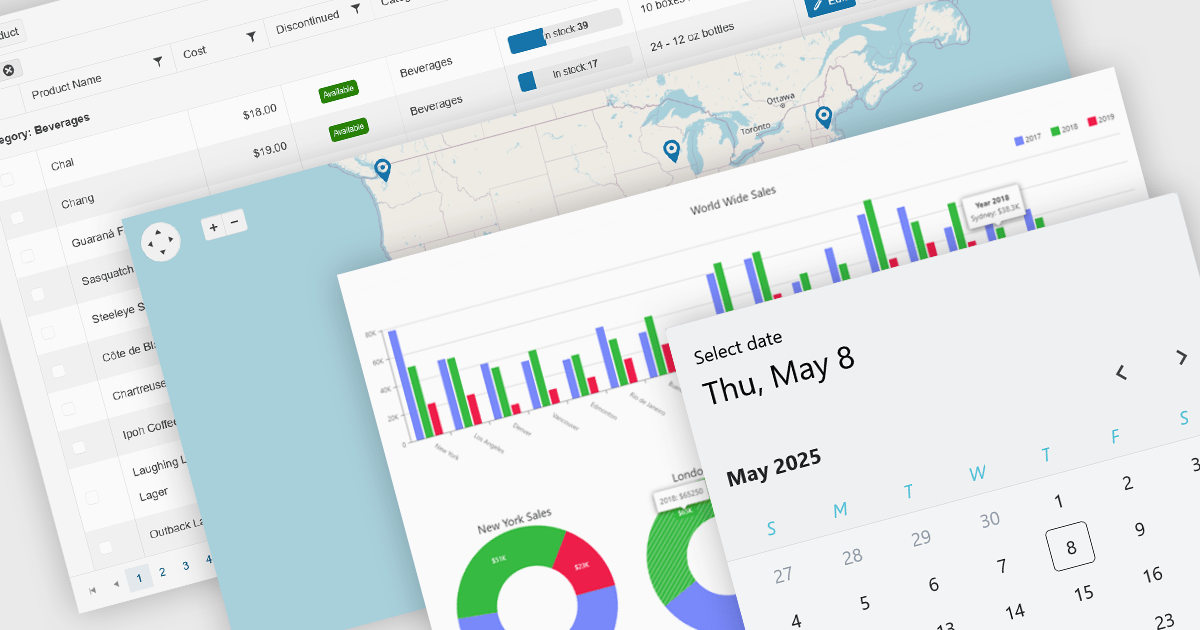
UI controls designed for use with Microsoft's Blazor framework, support full-stack development in C# and .NET, simplifying the creation of modern web applications. These controls are typically bundled into UI suites, providing developers with pre-built, customizable elements that improve the creation of rich, interactive web interfaces without needing JavaScript. By leveraging WebAssembly or server-side rendering, Blazor UI suites allow for an easy developer experience, consistent performance, and strong integration with existing .NET libraries and tooling.
Common controls include:
For an in-depth analysis of features and price, visit our Blazor UI suites comparison.
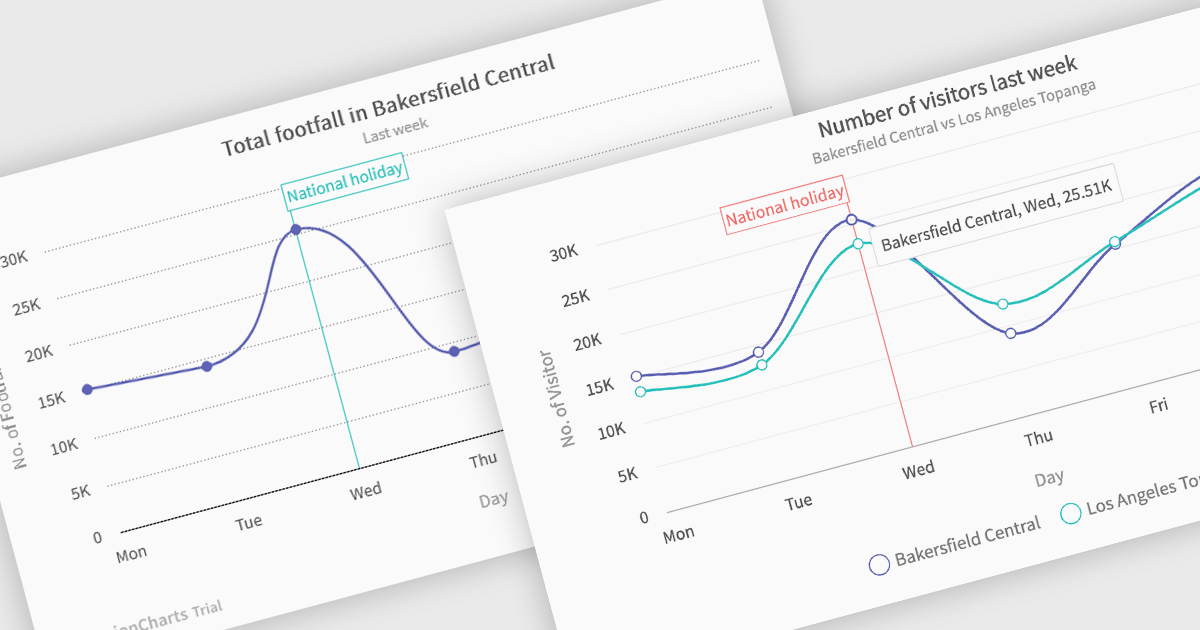
Spline charts are a type of line graph that displays continuous data points connected by smooth, curved lines, offering a visually fluid representation of trends and changes over time. This smoothing effect helps to highlight the overall trajectory of the data and can provide estimations of values between plotted points. Multi-Series Spline Charts extend this functionality by plotting multiple related datasets on the same graph, enabling direct visual comparison of their trends and the identification of correlations or divergences.
Several .NET Blazor chart controls offer spline charts including:
For an in-depth analysis of features and price, visit our .NET Blazor chart controls comparison.
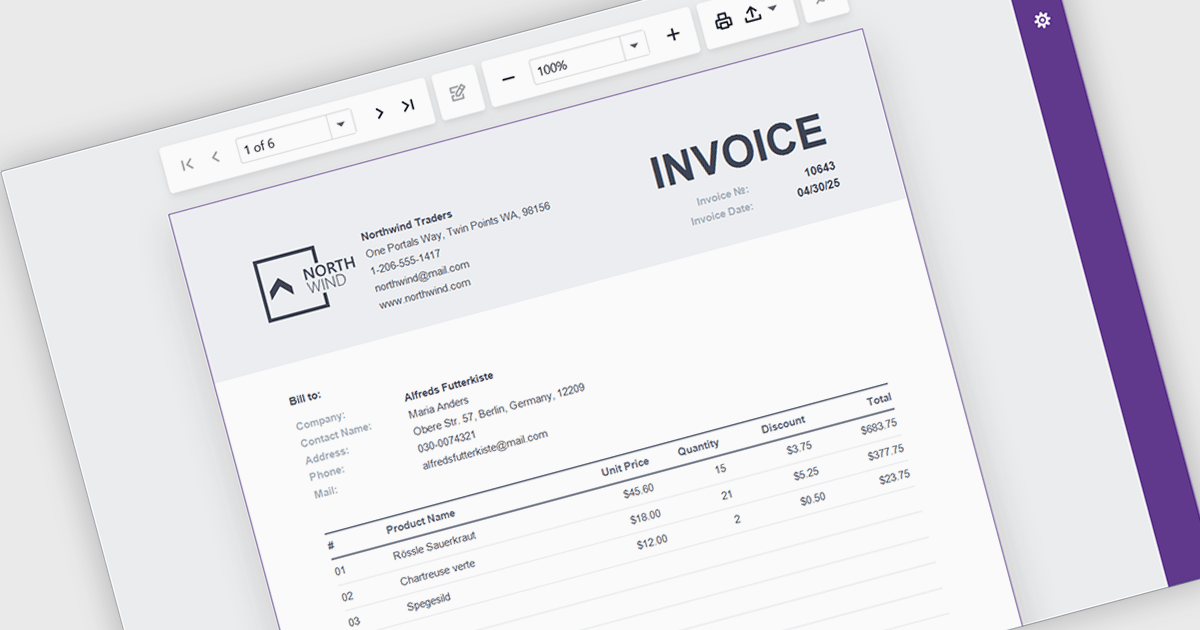
A report viewer is a UI element that renders and displays pre-built reports within a Blazor web application, allowing users to interact with them through features like pagination, parameter input, search, and export. It serves as the front-end interface for consuming reports generated by a reporting engine, often backed by data from databases or APIs. For developers, it enables seamless integration of reporting capabilities into Blazor applications without requiring page reloads or external viewers, supports responsive design for various devices, and maintains a consistent user experience through Blazor's component-based architecture.
Several Blazor Reporting Controls offer support for a report viewer including:
For an in-depth analysis of features and price, visit our comparison of Blazor Reporting Controls.
Data visualization and analysis features in grid components transform raw tabular data into structured, interpretable formats that support faster insights and decision-making. These features go beyond static display, offering dynamic ways to organize, summarize, and explore data directly within the grid interface, making it a powerful tool for both end-users and analysts.
Common features include:
For an in-depth analysis of features and price, visit our Blazor grid components comparison.


Tél : (888) 850 9911
Fax : +1 770 250 6199


