Fournisseur officiel
Comme nous somme les distributeurs officiels et autorisés, nous vous fournissons des licences légitimes directement à partir de 200+ éditeurs de logiciels.
Voyez toutes nos marques.

Highcharts Maps provides a standards-compliant method for creating schematic maps in web-based projects. It extends the user-friendly Highcharts JavaScript API to allow web developers to create interactive maps that display sales, election results, or any other geographically related information.
The Highchartts Maps v11.2.0 release adds support for interpolation in geographic heatmaps. The geoheatmap.interpolation feature allows the heatmap to render its data points as an interpolated image, estimating values between known data points. For example, you may have a have a table of temperature data that shows the temperature at specific points within a region. You can use interpolation to estimate the temperature in areas between the known data points. This new feature helps to create more easily understandable and visually appealing heatmaps, even with limited data sets.
To see a full list of what's new in version 11.2.0, see our release notes.
For more information, visit our Highcharts Maps product page.

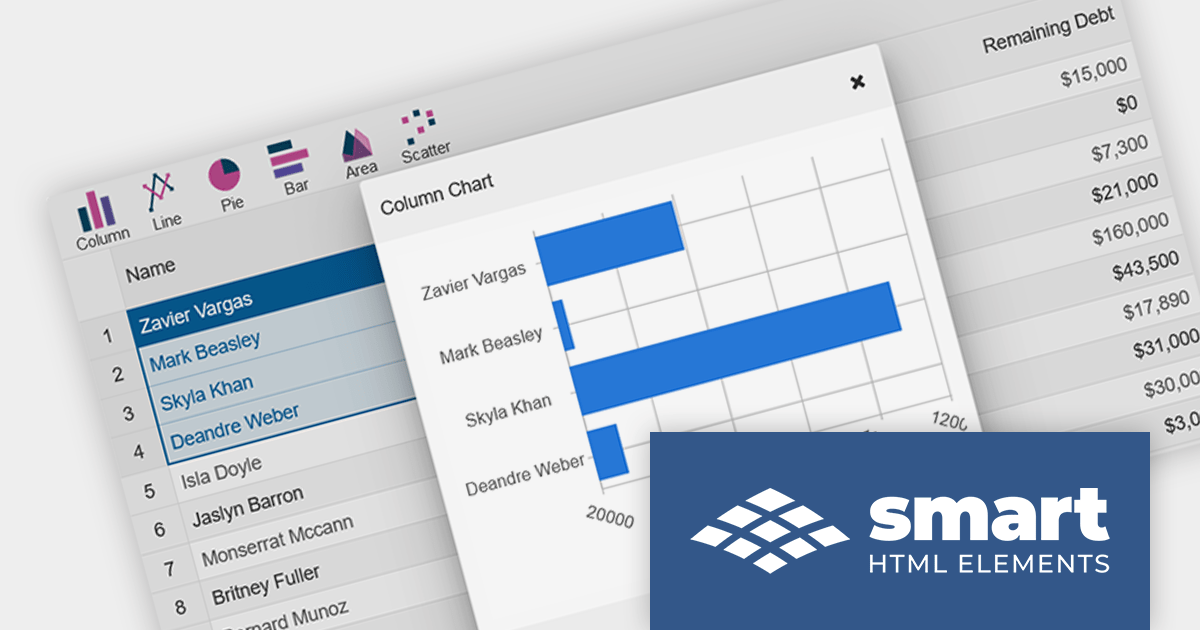
Smart HTML Elements is a JavaScript and Blazor web components UI library that provides over 50 components, including charts, grids, schedulers, Gantt charts, Kanban boards, docking layouts and pivot tables.
Version 17.1.0 adds support for Angular 17, a new release which takes advantage of deferrable views to improve performance, built-in control flow for a more intuitive syntax, and faster builds for hybrid and client-side rendering.
For more information, visit our Smart HTML Elements product page.

Highcharts is an industry-leading JavaScript charting library, used by tens of thousands of developers and over 80% of the world's 100 largest companies. Highcharts Core (formerly Highcharts JS) is an SVG-based, multi-platform charting library that has been actively developed since 2009.
Highcharts v11.2.0 adds new options for the presentation of Sankey chart types. The nodeAlignment option lets you specify which side of the chart nodes should align to, facilitating a vertical layout. The linkColorMode option determines the color mode for Sankey links, including matching the "from" node, the "to" node, or a gradient between the two.
Sankey charts are a type of flow diagram suited to visualizing complex data that changes over time. With the added Sankey chart display options, Highcharts now offers more impactful ways to visualize your data.
To see a full list of what’s new in v11.2.0, see our release notes.
For more information, visit our Highcharts Core product page.

OrgChart JS is a visual tool that helps managers illustrate the roles and hierarchy of an organization. It supports a variety of features, including grouping, assistant nodes, expand/collapse, search, performance, and multi-format exports for example to PDF, PNG, SVG or CSV.
The v8.12.13 release of OrgChart JS introduces undo/redo functionality, allowing users to easily reverse or repeat actions like adding or removing nodes, even after saving the chart. The undo/redo stack can be cleared to remove unnecessary steps or start fresh. Additionally, the number of steps in the stack can be checked for a clear overview of the history. Undo/redo history is stored in the browser's session storage, ensuring actions remain available even after refreshing or closing the browser. For extra security, this history can optionally be saved to a database, providing a permanent record of changes.
To see a full list of what's new in v8.12.13, see our release notes.
For more information, see our OrgChart JS product page.

MindFusion.Diagramming for JavaScript allows you create flow diagrams using predefined node shapes. You can use links to join nodes together and users can create, resize, select, move and modify nodes and links as needed. All diagram elements can be accessed programmatically and methods are available to changing the appearance of all elements.
The version 4.4 release has been extended to include support for animations. Diagram items support the animation of fill color, stroke color and opacity. Diagram nodes can now include bounce, shake, pulse and path animations. The diagram view itself now offers animated zooming and scrolling.
To see a full list of what's new in version 4.4, see our release notes.
For more information, visit our MindFusion.Diagramming for JavaScript product page.