








Fournisseur officiel
Comme nous somme les distributeurs officiels et autorisés, nous vous fournissons des licences légitimes directement à partir de 200+ éditeurs de logiciels.
Voyez toutes nos marques.
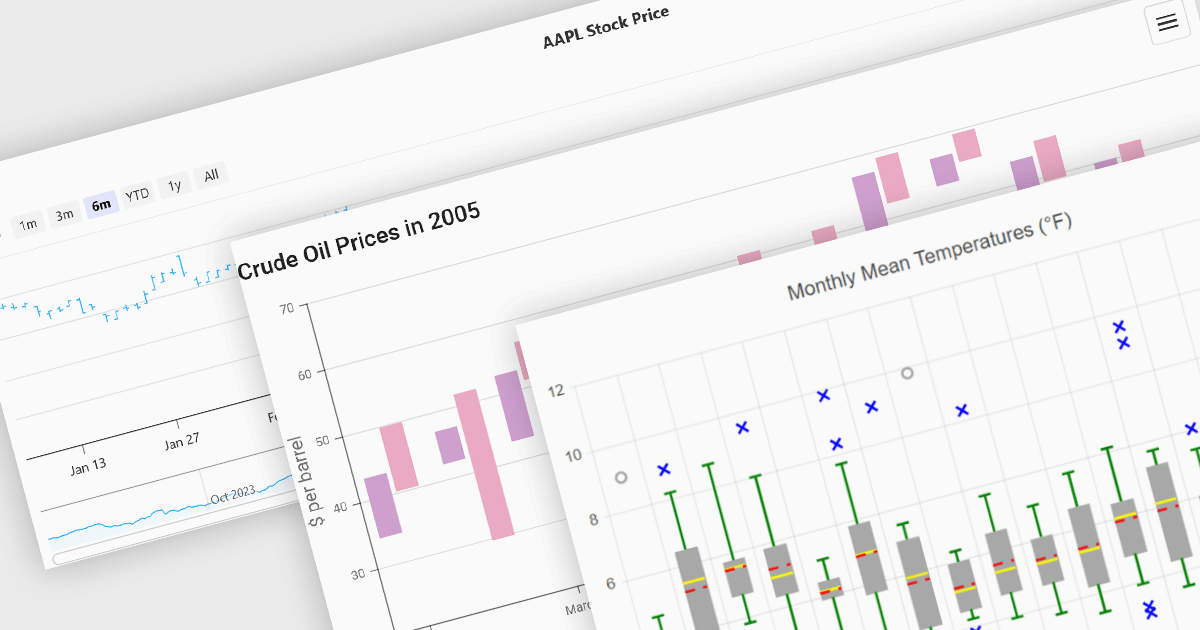
Financial chart components are used within software applications to visually represent complex financial data over time. They enable users, particularly those in trading, investment, and financial analysis, to interpret trends, compare performance, and make data-driven decisions more effectively. These components typically support a variety of chart types tailored to the unique requirements of financial datasets, allowing for granular analysis of price movements, market trends, and volatility.
Common features include:
For an in-depth analysis of features and price, visit our Vue.js Chart components comparison.
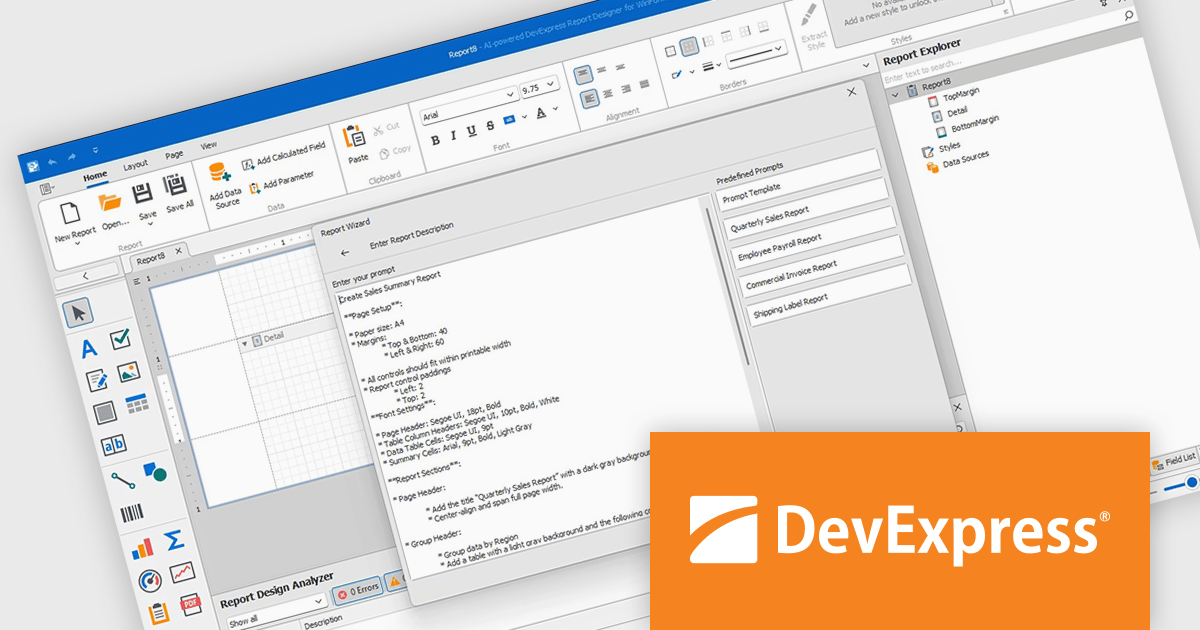
DevExpress Reporting is a comprehensive suite of reporting tools that empowers developers to create visually stunning and highly customizable reports for various applications. With its rich feature set, including data binding, layout design, printing, and exporting capabilities, DevExpress Reporting enables the efficient creation of reports that meet the most demanding business requirements.
The DevExpress Reporting v25.1 update introduces a new AI-powered Report Wizard (currently in Community Technology Preview), bringing natural language capabilities directly into the report design workflow. By allowing users to describe the report they need in plain text, the wizard interprets this input and automatically generates a matching report layout. This greatly reduces the time and expertise required to design reports, particularly for users who may not be familiar with the underlying report schema or expression syntax. It’s especially useful for quickly prototyping reports or enabling non-technical users to contribute to report design without writing code or manually configuring elements.
To see a full list of what's new in version 25.1, see our release notes.
DevExpress Reporting is licensed per developer and is available as a Perpetual License with a 12 month support and maintenance subscription. See our DevExpress Reporting licensing page for full details.
DevExpress Reporting is available to buy in the following products:
Handsontable is a JavaScript library designed to help developers build interactive data grids into their web applications. Offering a familiar spreadsheet-like interface, it allows users to edit, sort, and filter data with ease. Highly customizable and compatible with popular frameworks like React and Angular, Handsontable empowers developers to build robust data manipulation features into their web applications.
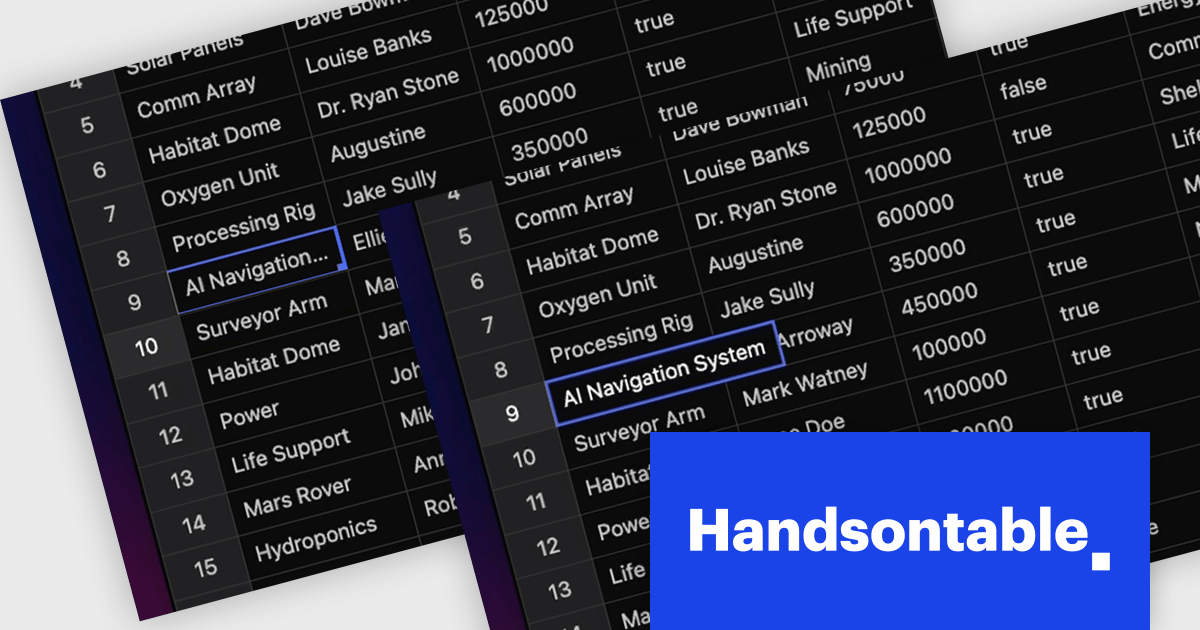
The Handsontable 16.0.0 update adds a new feature called 'textEllipsis' which improves the readability and layout of tables. When activated, this feature automatically replaces any overflowing text in a cell with an ellipsis (…), ensuring that excessive content does not spill over and disrupt the alignment of the table. This approach keeps tables visually clean while clearly signaling that additional content exists, making it easier for users to scan data-heavy views without distraction.
To see a full list of what's new in version 16.0.0, see our release notes.
Handsontable is licensed per developer and is available as an Annual or Perpetual license with 1 year support and maintenance. See our Handsontable licensing page for full details.
For more information, visit our Handsontable product page.
Stimulsoft Dashboards.JS is a JavaScript-based tool for creating interactive dashboards within web applications. Designed for developers and businesses, it provides customizable charts, graphs, and tables to visualize complex data from various sources. It supports popular JavaScript frameworks such as React, Vue.js, and Node.js, enabling seamless integration into modern web projects. With an intuitive interface and responsive design, it suits use cases like business intelligence, performance monitoring, and data-driven decision-making. Stimulsoft Dashboards.JS enhances user engagement and simplifies data analysis for industries such as finance, marketing, and logistics.
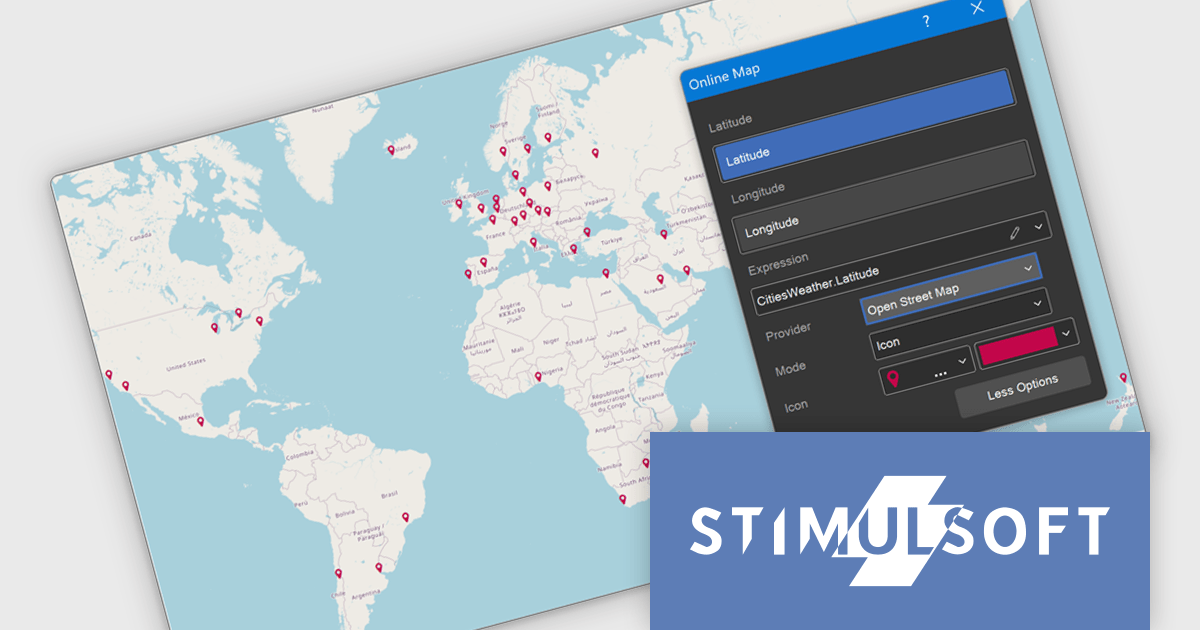
The Stimulsoft Dashboards.JS 2025.3.1 update introduces OpenStreetMap as the new default provider for the Online Map dashboard element, enabling developers to implement advanced geospatial visualizations without relying on external API keys. OpenStreetMap offers comprehensive support for multiple visualization modes, including icon, bubble, value, chart, and heat map, allowing for flexible and dynamic data presentation directly within dashboards. With this enhancement, developers gain a reliable, fully integrated mapping solution that aligns with open-source standards and simplifies deployment across projects.
To see a full list of what's new in 2025.3.1, see our release notes.
Stimulsoft Dashboards.JS is licensed per developer and is available as a Perpetual license with 1 year support and maintenance. See our Stimulsoft Dashboards.JS licensing page for full details.
Stimulsoft Dashboards.JS is available individually or as part of Stimulsoft Ultimate.
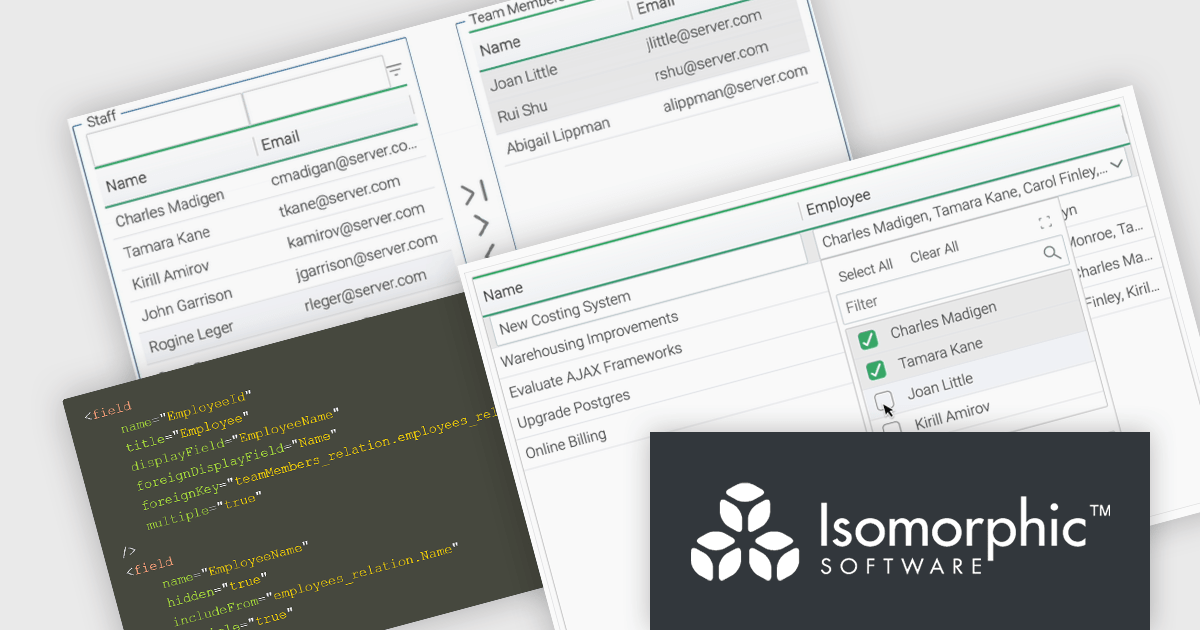
SmartClient is a comprehensive JavaScript component suite compatible with React, Vue, Angular, and more, that allows you to create large-scale, high-productivity web applications. It provides a comprehensive set of tools for developers, including advanced UI components, robust data management capabilities, and integration with modern backend technologies. Key features include dynamic data fetching, customizable grids, and a responsive interface for a wide range of devices. SmartClient enables developers to create applications with optimized performance, scalability, and a superior user experience. Ideal for enterprise-grade use cases, such as financial analytics, inventory management, and real-time reporting, SmartClient empowers organizations to deliver feature-rich applications that handle complex data requirements with ease.
Relations connect objects to each other and are used in databases and systems that are object-oriented. SmartClient lets you declare these relations in your data source using Relation Fields, providing a full access to related data without the need to write additional code. With two new user interface (UI) components for editing related records and the Relation Fields feature, it is now easier to manage many-to-many relationships. "MultiPickerItem" is a compact control used for inline form editing where the selected values appear inline and a pop-up displays checkboxes to enable users to select from a related data source. The Shuttle Interface can be embedded in any layout, including forms and modals, and provides a visual dual-panel interface for handling multi-item associations. These features simplify the management of relational data, offering users a declarative, scalable, and user-friendly approach.
SmartClient is licensed per developer and is available as both perpetual and subscription licenses. Product updates and technical support is also available. See our SmartClient licensing page for full details.
For more information, visit our SmartClient product page.





Tél : (888) 850 9911
Fax : +1 770 250 6199


