








Fournisseur officiel
Comme nous somme les distributeurs officiels et autorisés, nous vous fournissons des licences légitimes directement à partir de 200+ éditeurs de logiciels.
Voyez toutes nos marques.
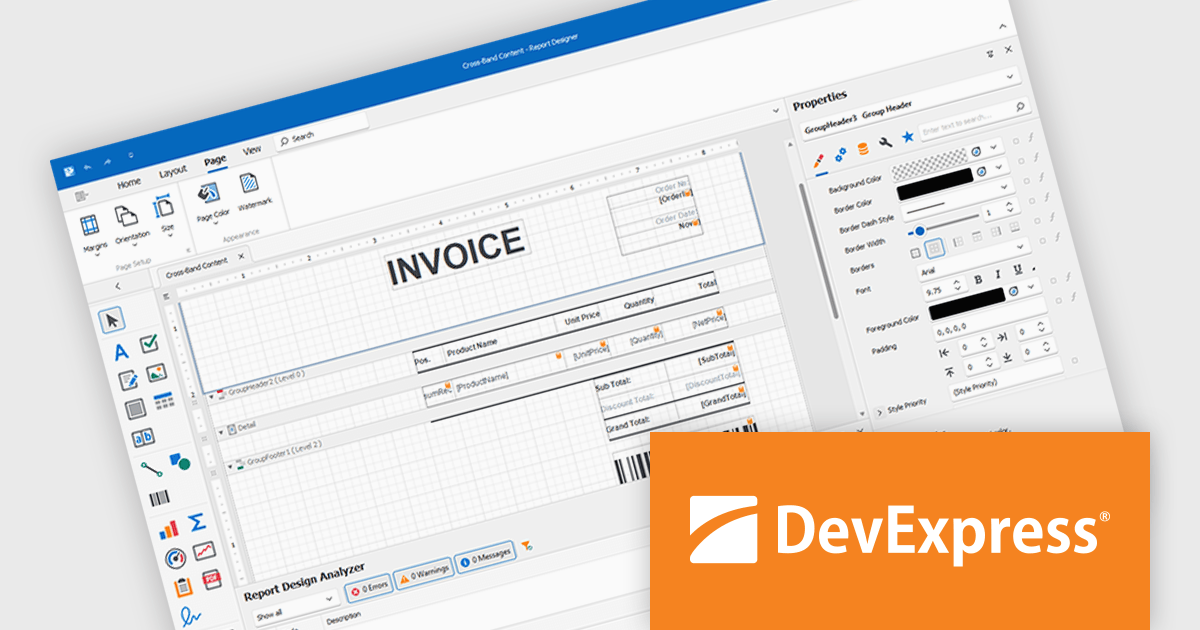
DevExpress Reporting is a comprehensive suite of reporting tools that help developers create visually stunning and highly customizable reports for various applications. With its rich feature set, including data binding, layout design, printing, and exporting capabilities, DevExpress Reporting enables the efficient creation of reports that meet the most demanding business requirements.
DevExpress Reporting lets developers build custom report controls that go beyond the built-in options, making it easier to meet specific project needs. These controls can include unique visual elements or functions that fit naturally into the existing reporting setup, keeping reports consistent in both appearance and behavior. Custom controls also help standardize design, support reusable logic, and handle specialized data presentation that standard controls may not cover, improving maintainability and scalability over time.
DevExpress Reporting is licensed per developer and is available as a Perpetual License with a 12 month support and maintenance subscription. See our DevExpress Reporting licensing page for full details.
DevExpress Reporting is available to buy in the following products:
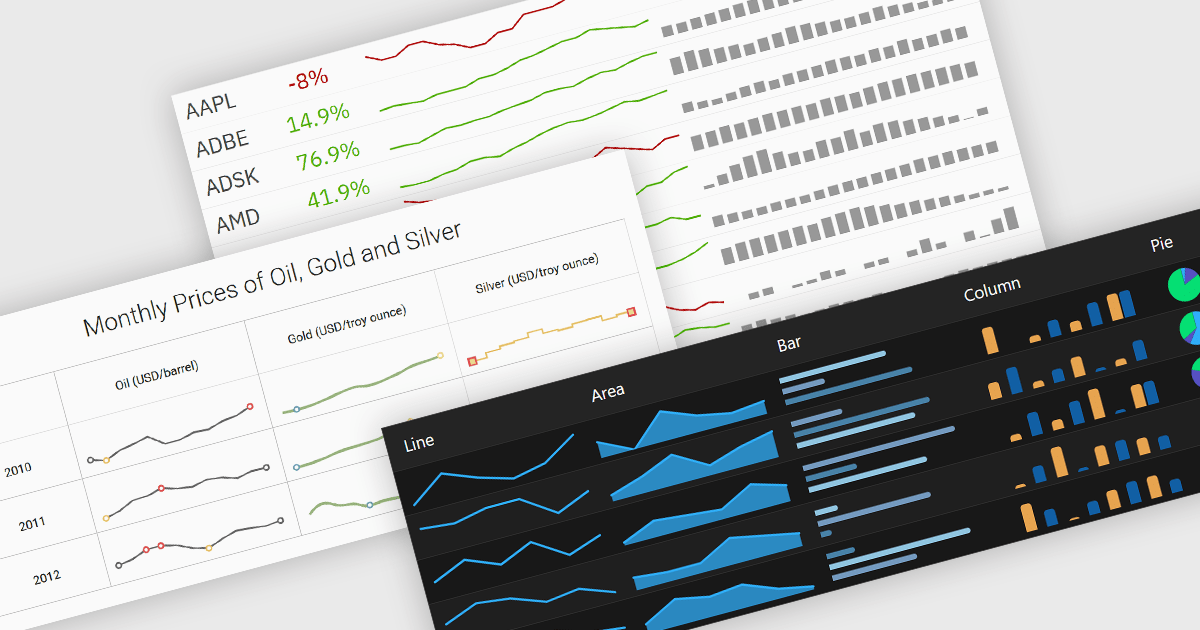
Typically embedded within text, tables/grids, or dashboards, sparklines are small-scale, data-driven graphics that present trends, patterns, or fluctuations within a dataset in a visually compact format. Unlike full-scale charts, sparklines do not include axes or labels, allowing them to present time-series or categorical data in a condensed form to deliver immediate visual cues without interrupting the flow of surrounding content. This design makes sparklines well-suited for highlighting patterns and changes over time or comparing multiple values side-by-side whilst helping users quickly identify key insights without leaving the context of the data.
Several Vue.js charting components offer sparkline functionality, including:
For an in-depth analysis of features and price, visit our comparison of Vue.js chart components.

ONLYOFFICE Docs Enterprise Edition with Drupal Connector lets teams edit and collaborate on office files directly within Drupal’s Media module, streamlining content creation and management. It integrates the full ONLYOFFICE Docs suite for text documents, spreadsheets, and presentations, supporting formats like DOCX, XLSX, PPTX, ODT, ODS, ODP, PDF, TXT, RTF, HTML, EPUB, and CSV with full OOXML compatibility. Users can create documents, build spreadsheets, and design presentations collaboratively in real time, all in their browser. With options for customization and rebranding, it enhances productivity and delivers a seamless, integrated digital experience.
The ONLYOFFICE Docs Enterprise Edition with Drupal Connector v9.0.4 update introduces the ability to edit PDF forms directly within Drupal, allowing developers and administrators to modify fields, adjust layouts, and update existing forms without re-uploading files. This enhancement improves form management by keeping all edits within the Drupal environment and saving changes back to the original templates, reducing versioning issues and eliminating the need for external tools. It simplifies maintenance, accelerates updates, and ensures that form templates remain consistent and accessible throughout the development lifecycle.
To see a full list of what's new in v9.0.4 (2.0.0), see our release notes.
ONLYOFFICE Docs is licensed by the number of simultaneous document connections and is available as an annual license with 1 year support and upgrades. See our ONLYOFFICE Docs licensing page for full details.
For more information, see our ONLYOFFICE Docs Enterprise Edition with Drupal Connector.
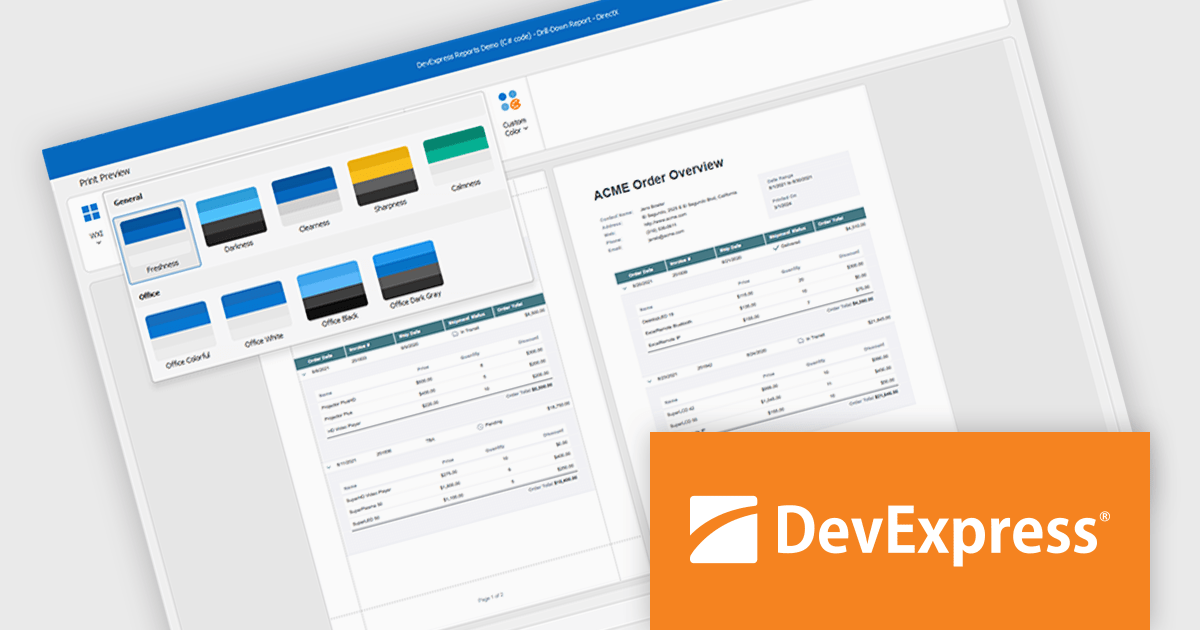
DevExpress DXperience is a comprehensive development suite that enables developers to build high-performance applications for Windows, Web, mobile, and tablet platforms using a unified set of controls and tools. It includes hundreds of desktop UI controls for WinForms, WPF, and reporting, as well as web UI controls for Blazor, ASP.NET, MVC, Core, Bootstrap Web Forms, JavaScript, Angular, React, Vue, and web reporting, plus productivity tools like XPO ORM and CodeRush for Visual Studio. With its extensive component library, DXperience accelerates development, ensures visually consistent and responsive interfaces, and is ideal for creating enterprise applications, data-driven web apps, dashboards, and reporting solutions.
DevExpress DXperience enhances application development with new app-wide themes and skins, allowing developers to apply a consistent, modern visual style across entire projects with minimal configuration. By providing professionally designed themes that align with Microsoft Office and Windows 11 aesthetics, along with built-in tools for customizing these designs, it improves the UI design process and reduces the need for manual styling. This enables developers to focus on functionality while delivering polished, cohesive user interfaces that improve usability and maintain a professional appearance across all application modules.
DevExpress DXperience is licensed per developer and is available as a Perpetual License with a 12 month support and maintenance subscription. See our DevExpress DXperience licensing page for full details.
For more information, visit our DevExpress DXperience product page.
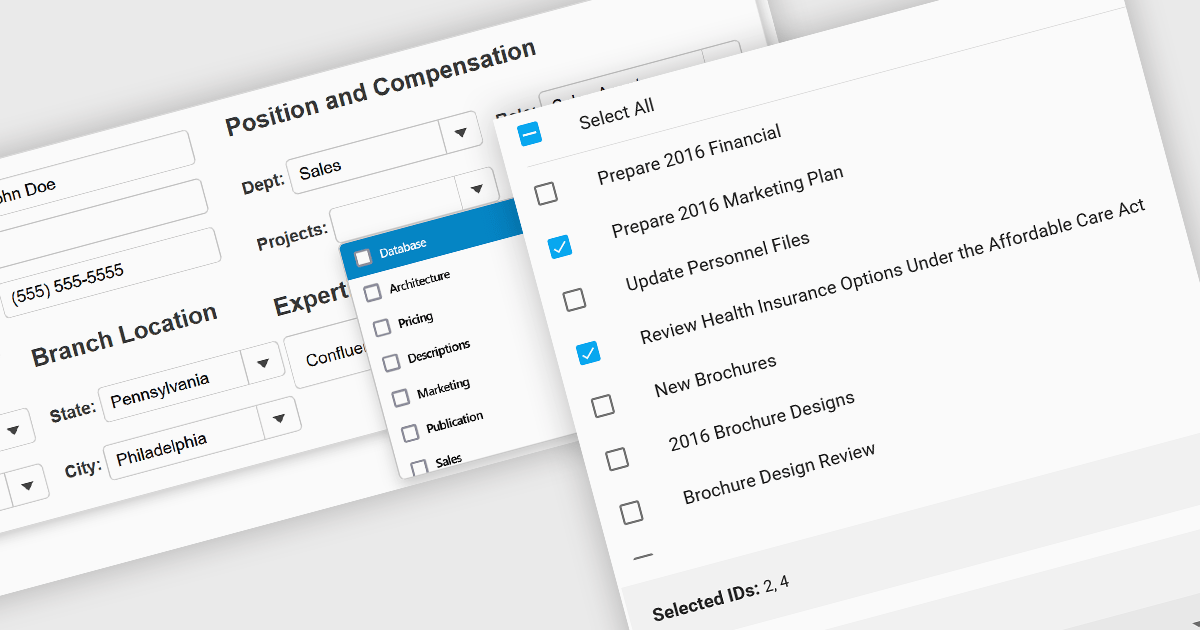
Checked listboxes provide users with a convenient interface for selecting multiple items within data editor controls. They enhance user workflows by combining the visual clarity of list presentations with the functionality of checkboxes, enabling intuitive multi-selection capabilities. Typically data-bound, these controls support both manual and programmatic manipulation of items, including checking, unchecking, and layout customization, facilitating dynamic and interactive list management in enterprise-grade applications.
Several Vue.js data editor collections include a checked listbox, including:
For an in-depth analysis of features and price, visit our Vue.js data editors comparison.





Tél : (888) 850 9911
Fax : +1 770 250 6199


