








Fournisseur officiel
Comme nous somme les distributeurs officiels et autorisés, nous vous fournissons des licences légitimes directement à partir de 200+ éditeurs de logiciels.
Voyez toutes nos marques.
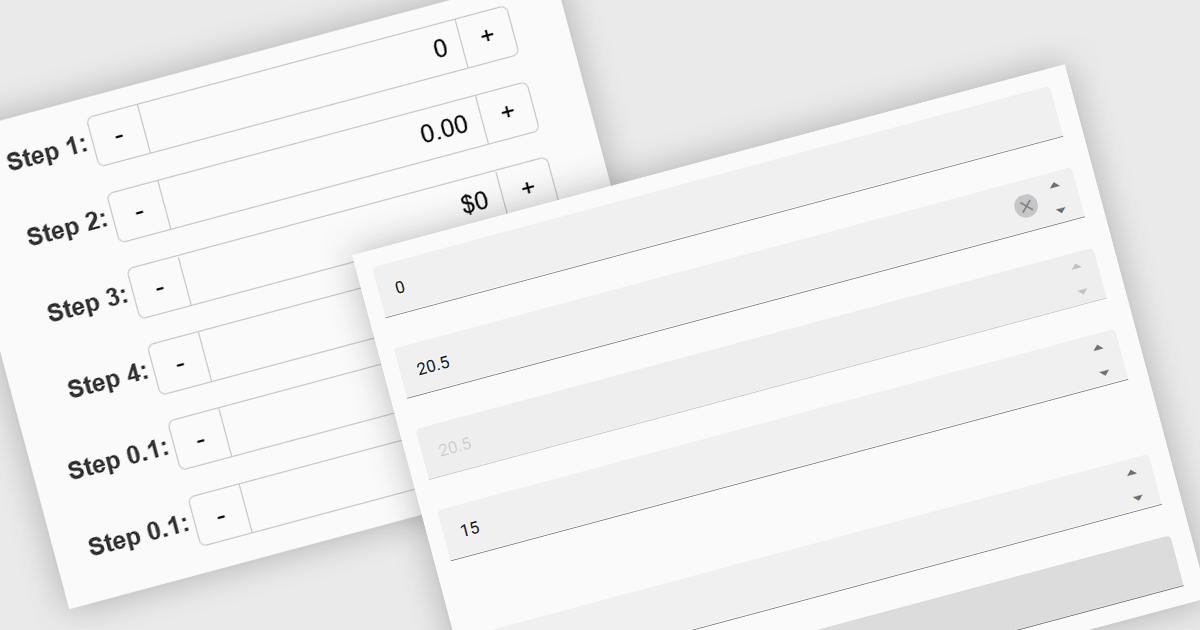
Numeric Spin data editor controls are intended for the efficient and precise input of numerical values. By combining an edit box with up/down spin buttons, users may either type to input directly or utilize the spin buttons to increase or decrease the value. This method promotes faster and less error-prone data entry than manual typing, particularly for large quantities or recurrent value revisions. Many spin editors include built-in validation, range limitations, data type selection, and formatting choices, which further improve data accuracy.
Several Vue.js data editor collections contain numeric spin components including:
For an in-depth analysis of features and price, visit our Vue.js data editors comparison.
PDF viewer components with PDF reading and writing capabilities can greatly enhance modern web applications, enabling seamless interaction with documents directly within the browser. These components commonly allow users to view, edit, annotate, and export PDF files without relying on external software, streamlining document management. By leveraging the power of web technologies, they offer a versatile and efficient solution for integrating PDF workflows into web applications, enhancing productivity and improving the user experience in industries where PDF handling is critical.
Common features include:
For an in-depth analysis of features and price, visit our JavaScript / HTML5 PDF Viewer components comparison.
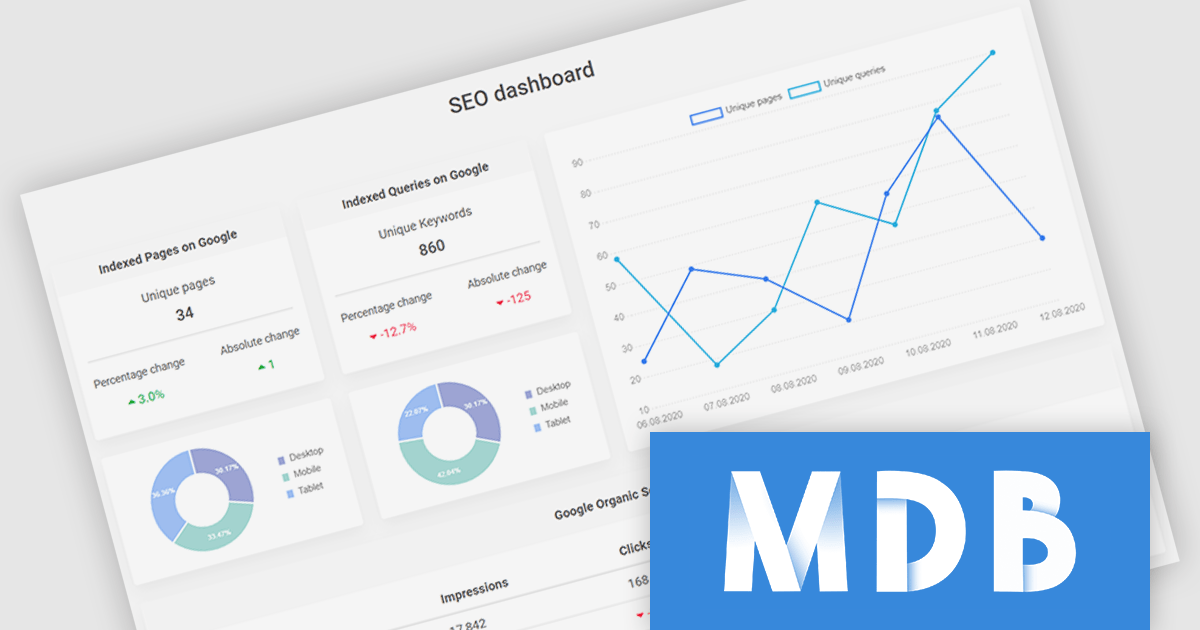
MDB Pro Vue by MDBootstrap is a premium front-end UI toolkit designed for Vue.js, offering a comprehensive collection of over 5,000 components, templates and plug-ins such as charts and advanced forms, to create responsive and visually appealing interfaces. With built-in design consistency, customization options, and seamless integration with Vue.js, MDB Pro Vue enables developers to build professional-grade web applications efficiently. Ideal for e-commerce sites, dashboards, and corporate projects, it empowers teams to enhance user experience while saving time and development costs.
MDB Pro Vue provides responsive, interactive, and customizable charts, enabling effective data visualization across various use cases. It offers an extensive range of chart types to suit diverse requirements, including bar and line charts for trends, pie and donut charts for proportions, polar area charts for variations in magnitude, and radar charts for multivariate data. Bubble charts add depth with size-based values, while scatter plots visualize data relationships. Fully customizable with options for colors, labels, tooltips, and animations, these charts integrate seamlessly into any design. Ideal for dashboards, analytics tools, and reporting interfaces, they deliver a polished, engaging user experience.
MDB Pro Vue is licensed per developer, per project/domain with packages for individual developers, development teams and Enterprises. See our MDB Pro Vue licensing page for full details.
MDB Pro Vue is available individually or as part of MDB Pro Bundle.
Stimulsoft Dashboards.JS is a JavaScript-based tool for creating interactive dashboards within web applications. Designed for developers and businesses, it provides customizable charts, graphs, and tables to visualize complex data from various sources. It supports popular JavaScript frameworks such as React, Vue.js, and Node.js, enabling seamless integration into modern web projects. With an intuitive interface and responsive design, it suits use cases like business intelligence, performance monitoring, and data-driven decision-making. Stimulsoft Dashboards.JS enhances user engagement and simplifies data analysis for industries such as finance, marketing, and logistics.
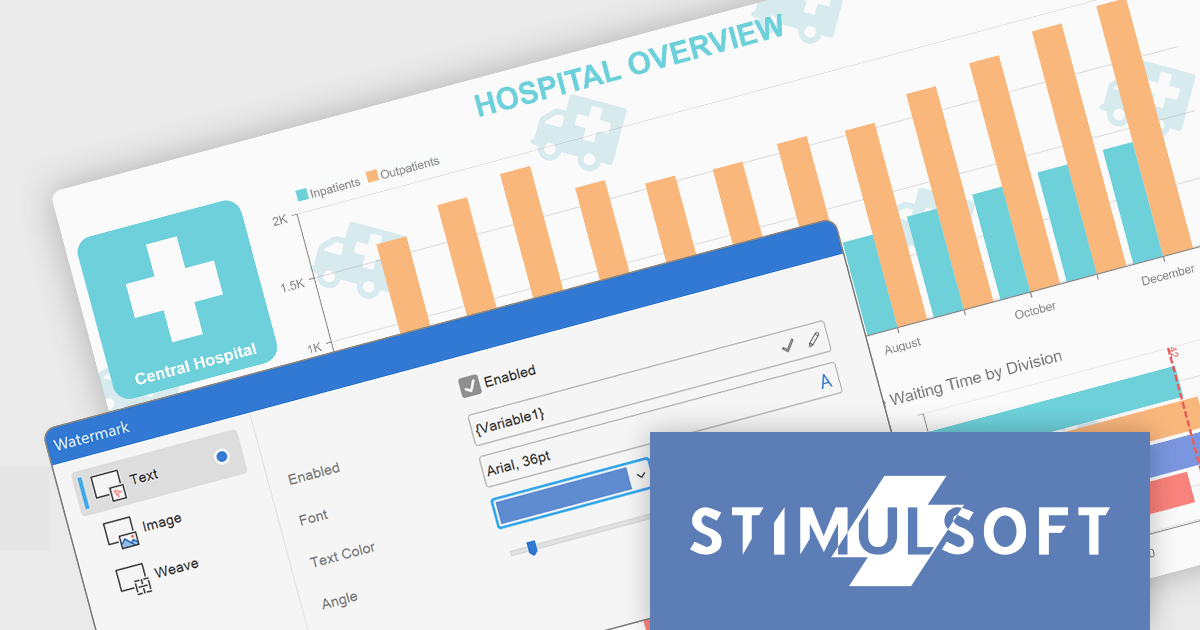
The Stimulsoft Dashboards.JS 2025.1.1 update introduces the ability to use expressions in dashboard watermarks, providing developers with enhanced flexibility to create dynamic and context-aware visual elements. This feature allows watermarks to adapt based on data or user-defined expressions, enabling the seamless integration of real-time information, branding, or contextual details directly into dashboards. By supporting Text, Image, Weave, and combined elements, the update streamlines customization and ensures that watermarks can align with specific design or functional requirements, helping developers deliver more polished and responsive dashboards.
To see a full list of what's new in 2025.1.1, see our release notes.
Stimulsoft Dashboards.JS is licensed per developer and is available as a Perpetual license with 1 year support and maintenance. See our Stimulsoft Dashboards.JS licensing page for full details.
Stimulsoft Dashboards.JS is available individually or as part of Stimulsoft Ultimate.
Wijmo by MESCIUS is a comprehensive suite of JavaScript UI components designed for building high-performance, enterprise-grade applications. With its lightweight, modular architecture, Wijmo provides developers with a rich set of tools, including data grids, charts, input controls, and advanced features such as PivotGrid and FinancialChart. Optimized for modern frameworks like React, Angular, and Vue, Wijmo offers seamless integration, flexibility, and extensive customization options.
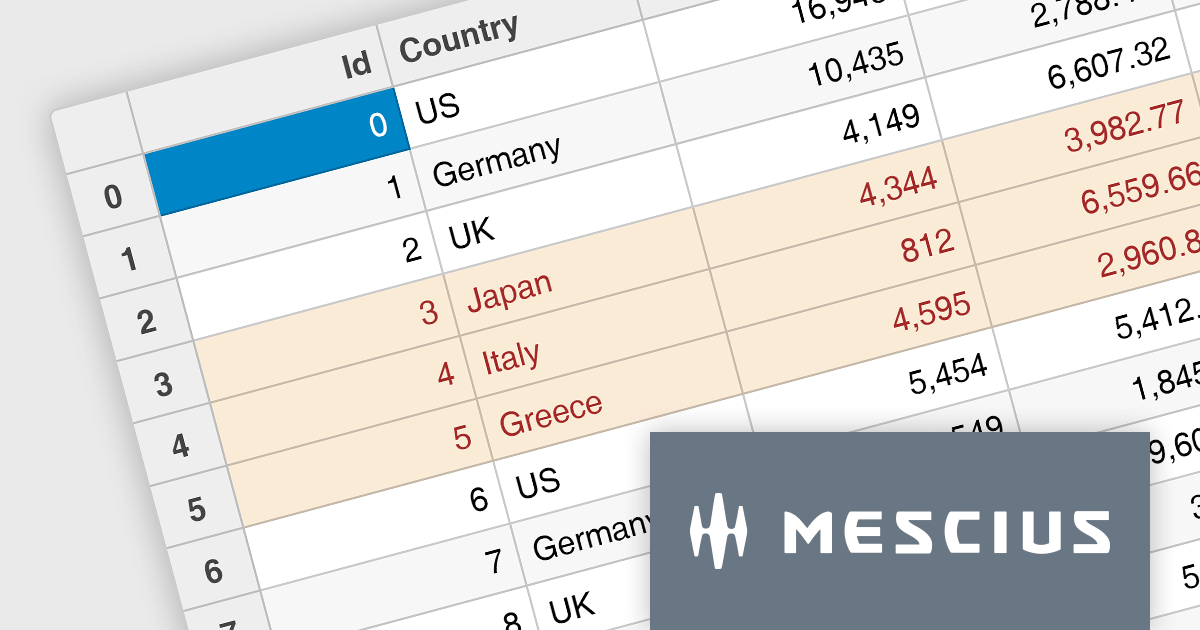
The Wijmo 2024 v2 Build 5.20242.30 update introduces a new API for cell styling in FlexGrid, providing developers with greater control and precision in customizing grid appearance. This enhancement allows developers to dynamically apply styles at the cell level based on data or state, ensuring a tailored and context-aware presentation of grid content. The API streamlines the process of defining and managing styles, reducing complexity and enabling cleaner, more maintainable code. By leveraging this capability, developers can create visually engaging and functionally responsive grids that align with specific application requirements, enhancing both user experience and application performance.
To see a full list of what's new in 2024 v2 Build 5.20242.30, see our release notes.
Wijmo is licensed per developer. Developer licenses are perpetual and include 1 year subscription which provides upgrades, including bug fixes and new features. See our Wijmo licensing page for full details.
Learn more on our Wijmo product page.





Tél : (888) 850 9911
Fax : +1 770 250 6199


