


Fournisseur officiel
Comme nous somme les distributeurs officiels et autorisés, nous vous fournissons des licences légitimes directement à partir de 200+ éditeurs de logiciels.
Voyez toutes nos marques.
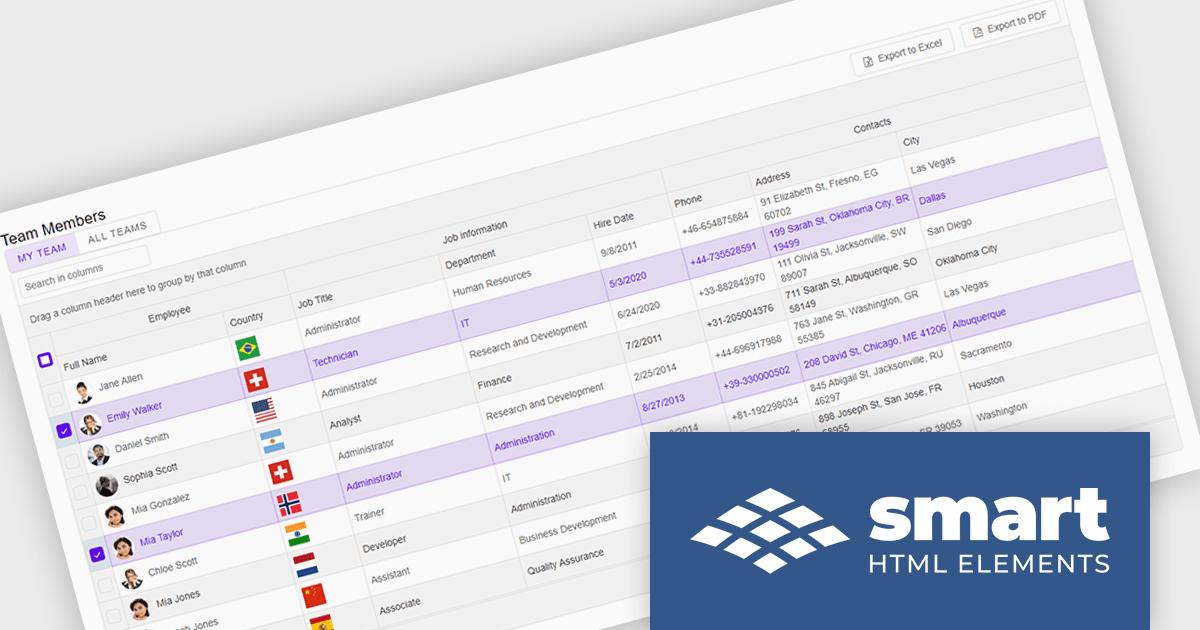
Smart UI by Smart HTML Elements is an enterprise-grade UI library offering pre-built web components for developers in Angular, React, Vue, Blazor, and JavaScript. It boasts over 60 ready-to-use components like grids, charts, schedulers, and editors, all featuring two-way data binding, responsiveness, accessibility, and theming capabilities. This library helps developers rapidly build dynamic and modern web applications with consistent look-and-feel and rich functionalities, accelerating development time and ensuring professional quality.
The Smart UI v21.0.0 release introduces significant enhancements to grid Excel export functionality. Users can now export one or more images from grids or components directly into Excel files and limit exports to selected rows or cells. These features provide greater flexibility, enabling users to include precisely the data they need while adding visual context to enhance understanding. The ability to tailor exports in this way ensures clearer communication of the underlying meaning and significance of the data.
To see a full list of what's new in v21.0.0, see our release notes.
Smart UI (Smart HTML Elements) is licensed per developer and is available as a perpetual license with 1 year support and maintenance. It includes distribution to unlimited Web applications, SaaS projects, Intranets and Websites. Team, OEM and Enterprise licensing options are also available. See our Smart UI licensing page for full details.
Learn more on our Smart UI product page.
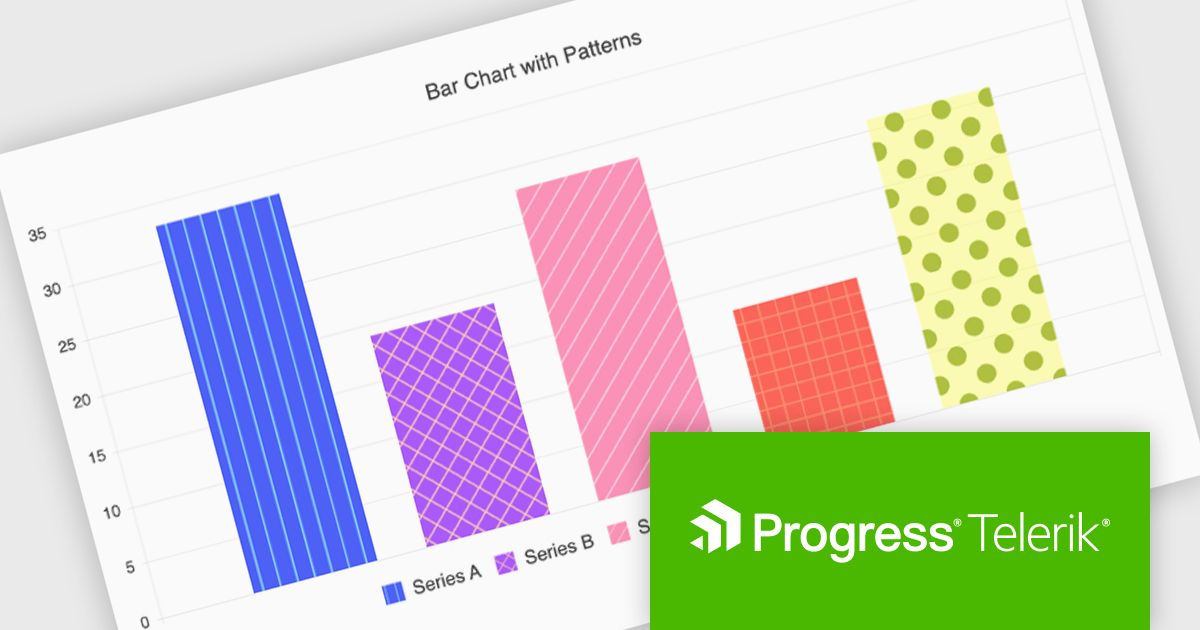
Kendo UI by Telerik is a comprehensive suite of JavaScript UI components designed to accelerate web application development. Offering pre-built, customizable elements for grids, charts, schedulers, and more, it streamlines UI creation across popular frameworks like jQuery, Angular, React, and Vue. Key features include responsive design, accessibility, and high performance, enhancing user experience. Developers benefit from reduced development time, consistent UI patterns, and the ability to build feature-rich applications faster.
The Kendo UI for Angular v17.1.0 release (part of the 2024 Q4 update) introduces flexible pattern designs for chart series, allowing developers to create visually distinctive and accessible data visualizations. By providing an alternative to solid colors, patterns such as stripes, dots, or grids improve clarity in charts, especially for users with color vision deficiencies or when detailed data differentiation is needed. This feature enables developers to align visualizations with branding guidelines or specific design needs while enhancing the overall user experience with more intuitive and inclusive data representations.
To see a full list of what’s new in v17.1.0 (2024 Q4) see our release notes.
Kendo UI is licensed per developer and is available as a perpetual license with a 1 year support subscription, which is available in 3 tiers: Lite, Priority or Ultimate. See our Kendo UI licensing page for full details.
Kendo UI is also available to buy individually or as part of:
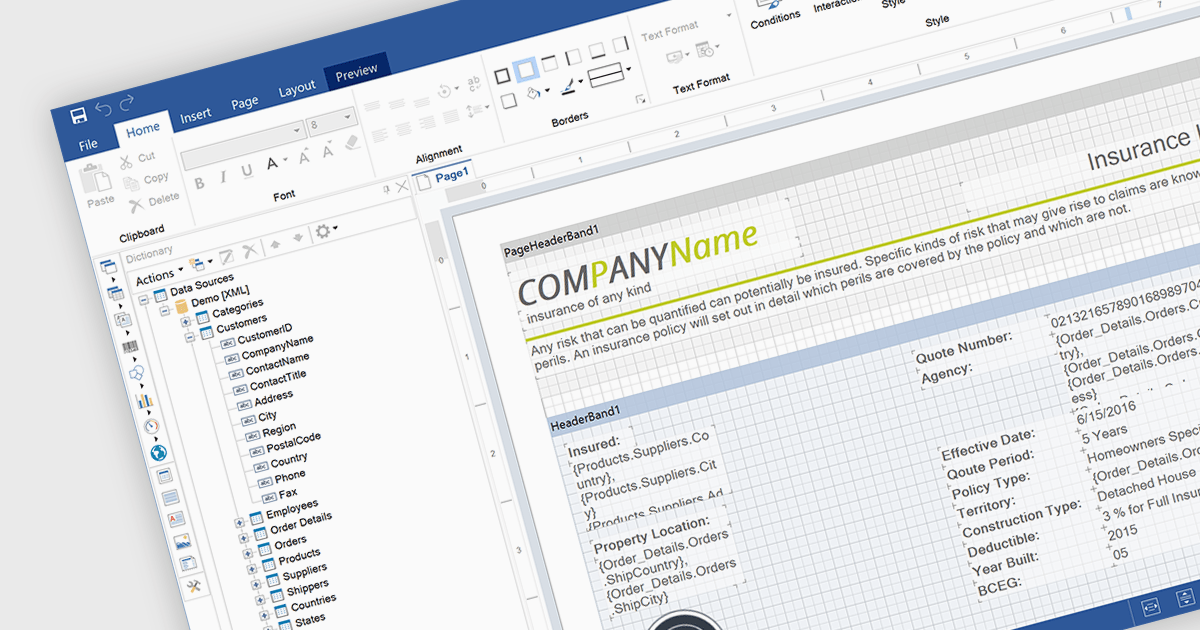
An end user report designer is a browser-based tool that allows non-technical users to create, edit, and customize reports directly within a web application, without needing to write code. It provides an intuitive interface for manipulating data fields, applying filters, formatting content, and configuring layouts, enabling efficient report creation that meets specific business needs. For developers, integrating such a designer reduces the overhead of building and maintaining custom reporting solutions, enhances user autonomy, and improves overall user satisfaction by empowering clients to adapt reports dynamically as their requirements evolve.
Several JavaScript Reporting controls offer an end user report designer including:
For an in-depth analysis of features and price, visit our comparison of JavaScript Reporting Controls.
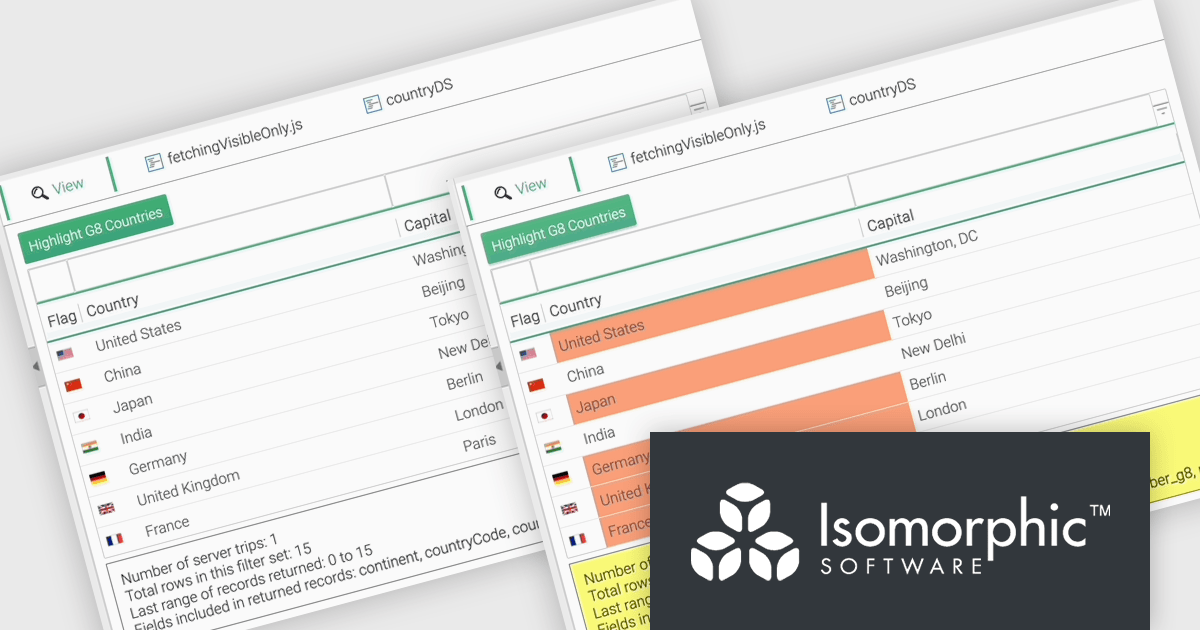
SmartClient is a comprehensive JavaScript component suite compatible with React, Vue, Angular, and more, that empowers you to craft large-scale, high-productivity Enterprise web applications. It provides a comprehensive set of tools for developers, including advanced UI components, robust data management capabilities, and seamless integration with modern backend technologies. Key features include dynamic data fetching, customizable grids, and a responsive interface for a wide range of devices. SmartClient enables developers to create applications with optimized performance, scalability, and a superior user experience. Ideal for enterprise-grade use cases, such as financial analytics, inventory management, and real-time reporting, SmartClient empowers organizations to deliver feature-rich applications that handle complex data requirements with ease.
The SmartClient 13.1 update introduces the Fetch Only Needed Data feature, enabling developers to optimize performance in data-intensive applications by dynamically retrieving only the fields required at a given moment. This targeted data retrieval reduces unnecessary data transfers, minimizes backend load, and enhances responsiveness. Developers can configure grids to fetch additional fields on demand, ensuring efficient resource usage while maintaining flexibility to adapt to dynamic application requirements. By integrating this feature, applications can scale effectively, provide a smoother user experience, and meet the demands of high-performance environments.
To see a full list of what’s new in version 13.1, see our release notes.
SmartClient is licensed per developer and is available as both perpetual and subscription licenses. Product updates and technical support is also available. See our SmartClient licensing page for full details.
For more information, visit our SmartClient product page.

LightningChart JS is a high-performance JavaScript charting library optimized for real-time data visualization. Leveraging WebGL and GPU acceleration, it enables developers to create interactive, complex charts capable of handling massive datasets with high refresh rates. Ideal for applications demanding rapid data updates and smooth interactions, LightningChart JS provides a robust API for customization and integration into web-based projects.
The LightningChart JS v6.1 update introduces the Parallel Coordinate Chart, a powerful tool designed for advanced data visualization and exploration. It allows developers to work with large-scale datasets, supporting over 100,000 series and multiple axes while maintaining high performance. This chart type is optimized for real-time data input, enabling smooth updates at high stream rates. With features like value-based coloring, range-based highlighting, and interactive cursors, it provides an intuitive way to analyze and interpret complex data relationships, making it an essential addition for creating data-driven applications.
To see a full list of what's new in v6.1, see our release notes.
LightningChart JS is licensed based on method of deployment with options including SaaS Developer Licenses, Application Developer Licenses, and Publisher Developer Licenses. Each license is perpetual and includes 1 year subscription for technical support and software updates. See our LightningChart JS licensing page for full details.
Learn more on our LightningChart JS product page.


Tél : (888) 850 9911
Fax : +1 770 250 6199


