








Fournisseur officiel
Comme nous somme les distributeurs officiels et autorisés, nous vous fournissons des licences légitimes directement à partir de 200+ éditeurs de logiciels.
Voyez toutes nos marques.

Vue diagrams are interactive visual representations, used to illustrate complex data structures, workflows, or system architectures. They leverage Vue's reactivity and component-based architecture to dynamically update as data changes, providing developers with an intuitive way to display and manage intricate relationships in real-time. Vue diagrams enhance the clarity of application logic, simplify debugging, and improve user experience by offering a clear, visual way to represent processes or data flows. This ultimately leads to more efficient development and better communication of complex concepts within the application.
Several Vue.js UI suites offer diagram controls including:
For an in-depth analysis of features and price, visit our Vue js UI suite comparison.
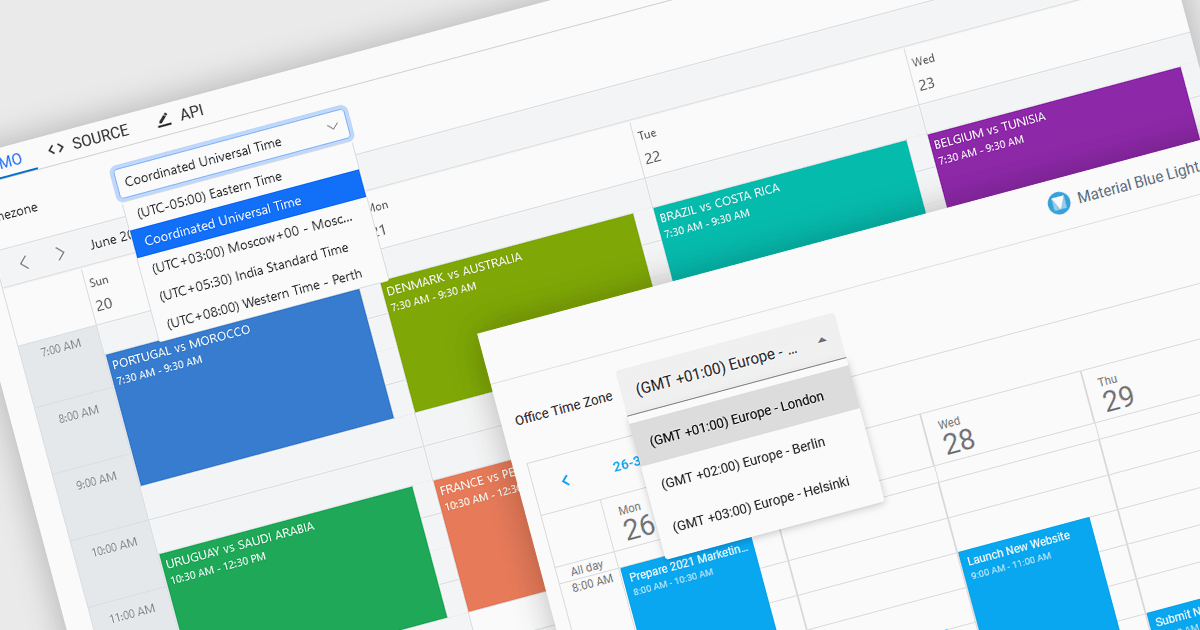
Time zone support in a scheduling component enables users to create, view, and manage events across different regions without manual time conversion. It automatically adjusts appointments based on the user’s local time zone and accounts for daylight saving time (DST) changes, ensuring accurate scheduling. This feature is particularly beneficial for global teams, remote workers, and businesses coordinating across multiple time zones. For example, an international company can schedule a meeting for participants in New York, London, and Tokyo, and each attendee will see the event in their local time. Time zone support eliminates confusion, reduces scheduling errors, and improves efficiency in cross-border collaboration.
Several JavaScript products offer scheduling components with time zone support including:
Explore our range of JavaScript scheduling components.
Need help to find the right software license, upgrade or renewal? Call, Email, or Live Chat with our experts.
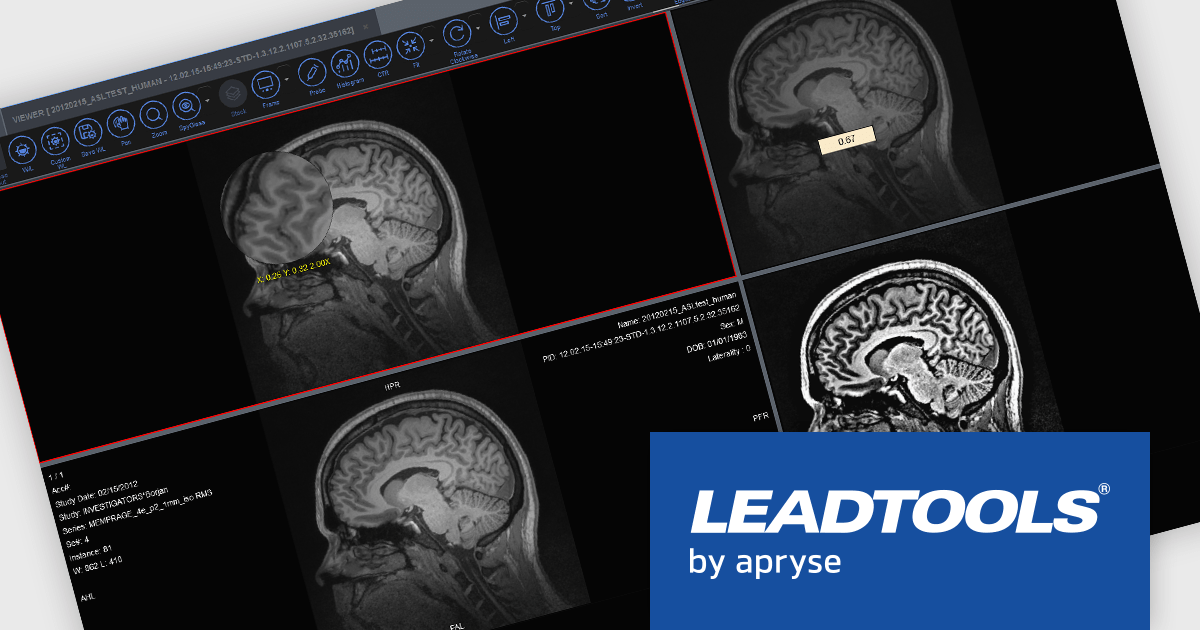
LEADTOOLS Medical SDK is designed to streamline the development of medical applications, offering support for DICOM datasets, 8-16 bit extended grayscale images, and advanced image annotation capabilities. It also includes specialized tools for displaying images, such as window leveling and LUT (Look-Up Table) processing, as well as medical-specific image processing. Additional features include lossless JPEG compression and the ability to process both signed and unsigned image data. The Medical Imaging Suite expands on this functionality with enhanced features, including HTML/JavaScript viewing for web-based medical image access.
LEADTOOLS Medical 3D Volume Rendering libraries enable developers to visualize medical data using techniques like VRT, MIP, MPR, and SSD. These tools provide interactive controls for window levels, zoom, and density adjustments, along with customizable settings for appearance, such as borders and resolution. The libraries enhance performance with cached 3D volumes for faster load times and include advanced features like 3D reference lines and synchronized stack navigation with a 3D cursor, making it a valuable tool for precise and efficient medical imaging applications.
LEADTOOLS Medical SDK is licensed as Development Licenses, for developers to use the SDKs, and Deployment Licenses, for the right to distribute end user solutions. See our LEADTOOLS Medical SDK licensing page for full details.
Learn more on our LEADTOOLS Medical SDK product page and LEADTOOLS Medical Suite SDK product page.
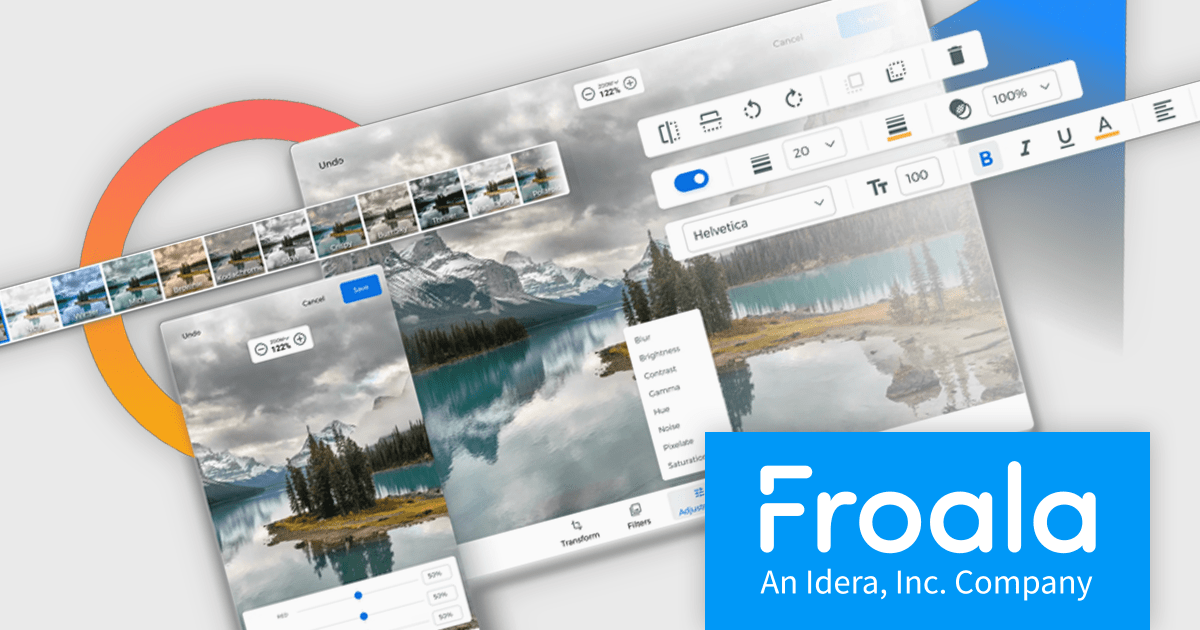
Froala Editor is a JavaScript-based WYSIWYG HTML editor that empowers developers to seamlessly integrate rich text editing functionalities into their applications.
The Froala Editor 4.3 release offers a new "Transform" button in the image editing popup, allowing users to enhance images directly within the editor. This feature allows users to apply filters, resize images, and make various other adjustments with ease. Once changes are made, the image is instantly replaced with the transformed version. This integration streamlines the editing process, offering users greater control and flexibility over their visual content without needing to leave the editor.
To see a full list of what's new in 4.3, see our release notes.
Froala Editor is licensed per product and domain. It is available as an annual or perpetual license with version upgrades and support. See our Froala Editor licensing page for full details.
For more information, visit our Froala Editor product page.
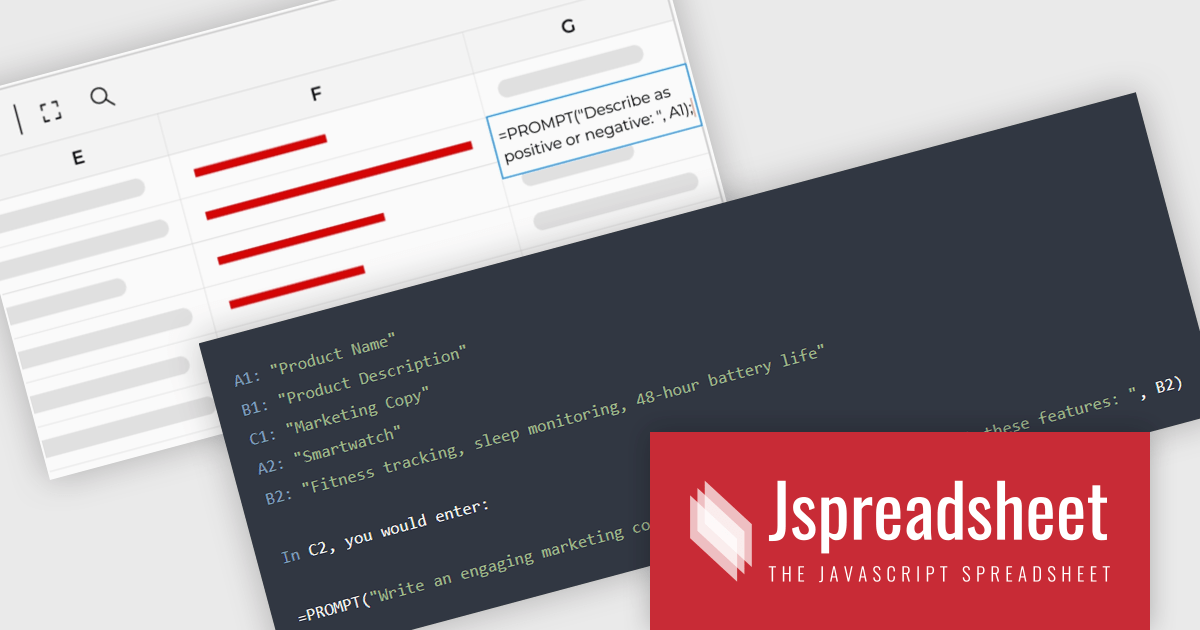
Jspreadsheet Pro is a flexible JavaScript-based spreadsheet solution that enables developers to create customizable, feature-rich data grids for web applications. It offers advanced formulas, data validation, and API integrations. Ideal for tasks like financial modeling, inventory management, and project tracking, it helps businesses efficiently manage and analyze data. Its backend server integration supports real-time data processing, enhancing workflows and boosting productivity across various industries.
Jspreadsheet Pro seamlessly incorporates ChatGPT API into data grids. This integration facilitates automated content generation, efficient response management, and comprehensive data analysis. For full functionality it requires the Jspreadsheet Server extension which enables front-end queries to communicate with the API via your back-end, delivering real-time data and insights to users.
Jspreadsheet Pro is licensed as an Annual or a Perpetual License with support and maintenance. We can supply any Jspreadsheet Pro license including new licenses, maintenance renewals, and upgrade licenses. See our Jspreadsheet Pro for full details.
For more information, visit our Jspreadsheet Pro product page.





Tél : (888) 850 9911
Fax : +1 770 250 6199


