


Fournisseur officiel
Comme nous somme les distributeurs officiels et autorisés, nous vous fournissons des licences légitimes directement à partir de 200+ éditeurs de logiciels.
Voyez toutes nos marques.

DevExtreme Complete is a robust suite of tools by DevExpress designed to streamline the development of high-performance web applications. It includes a wide range of UI components for modern frameworks such as Angular, React, Vue, and jQuery, making it ideal for developers aiming to create responsive, cross-platform applications with ease. With features like rich data visualization, interactive grids, form controls, and adaptive layouts, it empowers developers to deliver polished and user-friendly interfaces. Whether you're building enterprise dashboards or consumer-facing apps, DevExtreme Complete provides the flexibility and power to meet complex requirements while maintaining performance and usability.
The DevExtreme Complete 25.2 release brings AI Columns to its DataGrid and TreeList components, allowing developers to infuse artificial intelligence directly into their data presentation layers. AI Columns use component data and custom prompts to generate contextually relevant values - automating tasks like categorization, summarization, translation, and recommendation. Whether grouping records by priority, detecting sentiment, or transforming addresses, this feature opens up new ways to interact with and analyze structured data, making these components powerful tools for AI-assisted data exploration.
To see a full list of what's new in version 25.2, see our release notes.
DevExtreme Complete is licensed per developer and is available as a Perpetual License with a 12 month support and maintenance subscription. See our DevExtreme Complete licensing page for full details.
DevExtreme Complete is available to buy individually or as part of the following products:
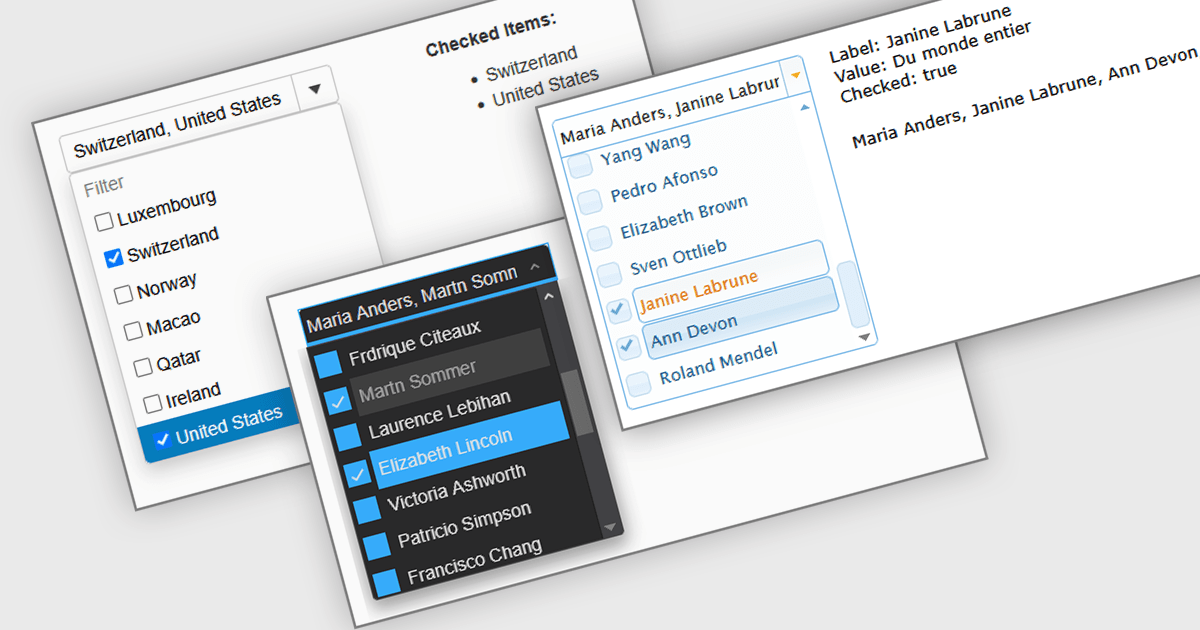
A Checked Combobox in a JavaScript Data Editor is a user interface component that allows users to select multiple options from a dropdown list using checkboxes. It combines the compact form of a combobox with the functionality of a multi-select control, helping to conserve screen space while enabling clear, granular input. This component simplifies data entry and editing workflows, particularly when working with datasets that require multiple discrete values to be associated with a single field. For developers, it offers a way to manage complex form inputs more efficiently, improving both usability and data integrity in cross-platform data management applications.
Several JavaScript data editors offer checked combobox functionality including:
For an in-depth analysis of features and price, visit our comparison of JavaScript data editors.
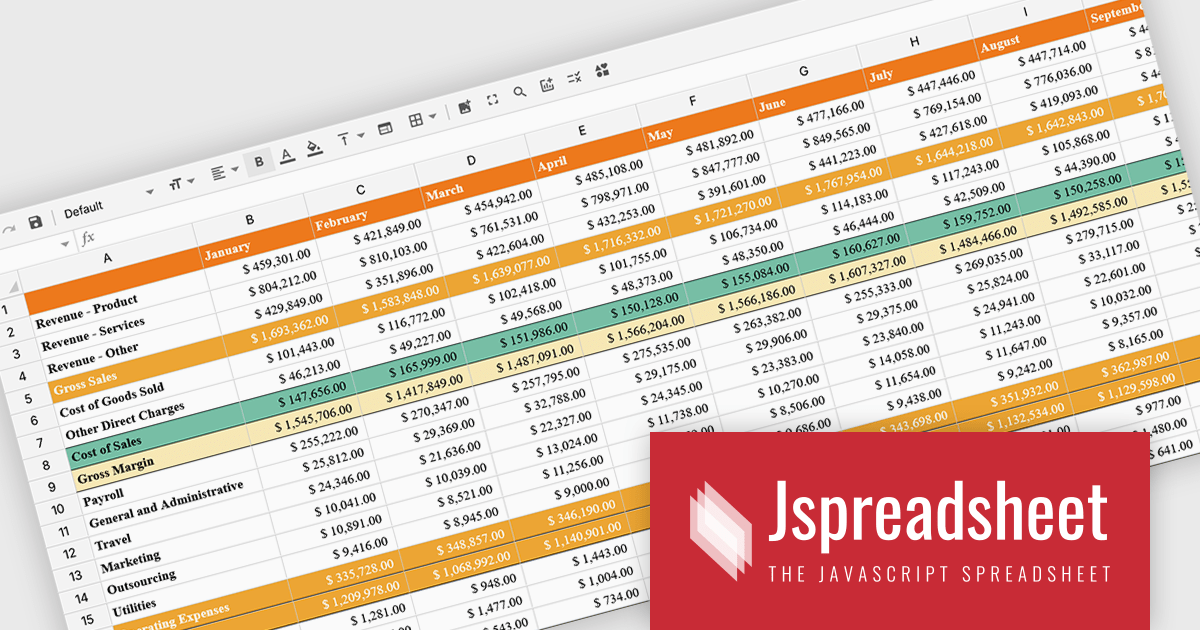
Formula and function support in spreadsheets enables users to perform mathematical, statistical, financial, and logical calculations directly within cells, transforming raw data into meaningful results. By automating calculations and ensuring consistent logic across datasets, this capability improves accuracy, saves time, and supports real-time updates as data changes. It allows users to analyze trends, validate data, and model scenarios without relying on external tools. Common use cases include financial forecasting, budgeting, statistical analysis, performance reporting, and operational planning, making spreadsheets a powerful and flexible platform for data-driven decision-making across business, finance, and technical teams.
Several Vue spreadsheet controls offer formula and function support including:
For an in-depth analysis of features and price, visit our Vue spreadsheet controls comparison.

SpreadJS is a JavaScript spreadsheet and data visualization component built to deliver Excel-compatible functionality within web applications. It provides a flexible, high-performance interface for displaying and manipulating tabular data, supporting advanced features such as formulas, pivot tables, charts, conditional formatting, and data binding. SpreadJS integrates smoothly with popular frameworks like React, Angular, and Vue, and includes robust import and export capabilities for Microsoft Excel files. It is commonly used in enterprise applications where users need a responsive, interactive spreadsheet experience directly in the browser.
The SpreadJS 19.0.0 update introduces a new Collaboration Server Add‑on that enables real‑time, multi‑user editing of the same spreadsheet within web applications by integrating the collaboration framework and server infrastructure directly into SpreadJS. This add‑on lets developers build functionality where multiple clients see and apply changes instantly to workbook data with consistent state across users, supports conflict‑free concurrent edits using Operational Transformation logic, and includes features such as live user presence and permission controls.
To see a full list of what's new in 19.0.0, see our release notes.
SpreadJS is licensed per developer and includes 1 Year Maintenance (major and minor version releases and unlimited support phone calls). SpreadJS requires an Annual or Perpetual Deployment License. The optional Add-ons are available at an additional cost, and require a SpreadJS license. See our SpreadJS licensing page for full details.
For more information, visit our SpreadJS product page.
Jspreadsheet Pro is a flexible JavaScript-based spreadsheet solution that enables developers to create customizable, feature-rich data grids for web applications. It offers advanced formulas, data validation, and API integrations. Ideal for tasks like financial modeling, inventory management, and project tracking, it helps businesses efficiently manage and analyze data. Its backend server integration supports real-time data processing, enhancing workflows and boosting productivity across various industries.
The Jspreadsheet Pro v12 update improves handling of large datasets by introducing an extended viewport with optimized rendering that processes only the visible portion of the spreadsheet. This enhancement reduces memory usage, maintains interface responsiveness, and enables smooth interaction even when working with very large or complex data structures. It provides developers with a more scalable foundation for building applications that require high-performance spreadsheet capabilities without compromising speed or usability.
To see a full list of what's new in version 12, see our release notes.
Jspreadsheet Pro is licensed as an Annual or a Perpetual License with support and maintenance. We can supply any Jspreadsheet Pro license including new licenses, maintenance renewals, and upgrade licenses. See our Jspreadsheet Pro for full details.
For more information, visit our Jspreadsheet Pro product page.


Tél : (888) 850 9911
Fax : +1 770 250 6199


