








Fournisseur officiel
Comme nous somme les distributeurs officiels et autorisés, nous vous fournissons des licences légitimes directement à partir de 200+ éditeurs de logiciels.
Voyez toutes nos marques.
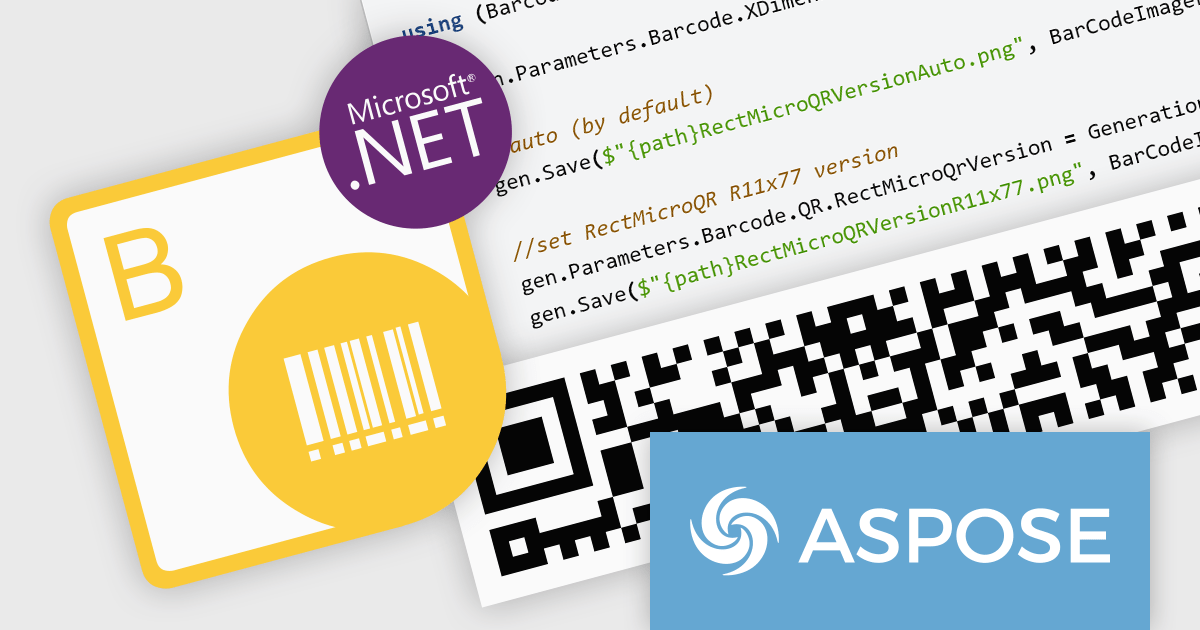
Aspose.BarCode for Python via .NET empowers your Python applications with robust barcode functionality. This versatile library seamlessly integrates into your development workflow, enabling effortless generation and scanning of diverse barcode symbologies. Enjoy granular control over barcode appearance, customizing colors, size, captions, and more to suit your precise requirements. Efficient multi-threading ensures swift and accurate recognition of single or multiple barcodes within images, optimizing your productivity and data processing efficiency.
The Aspose.BarCode for Python via .NET V24.1 release adds support for rMQR barcodes. This expands its utility in industries employing high-volume data transmission and real-time tracking. rMQR's high density and error correction capabilities excel in encoding large datasets within compact barcodes, ideal for product authentication, logistics, and supply chain management.
To see a full list of what's new in V24.1, see our release notes.
Aspose.BarCode for Python via .NET is offered as Developer Small Business, Developer OEM, Developer SDK, Site Small Business, Site OEM, and Site SDK licenses catering to a range of business needs. Licenses are perpetual, and include 1 year of support and maintenance. Subscription renewals are also available. See our Aspose.BarCode for Python via .NET licensing page for full details.
Aspose.BarCode for Python via .NET is available in the following products:
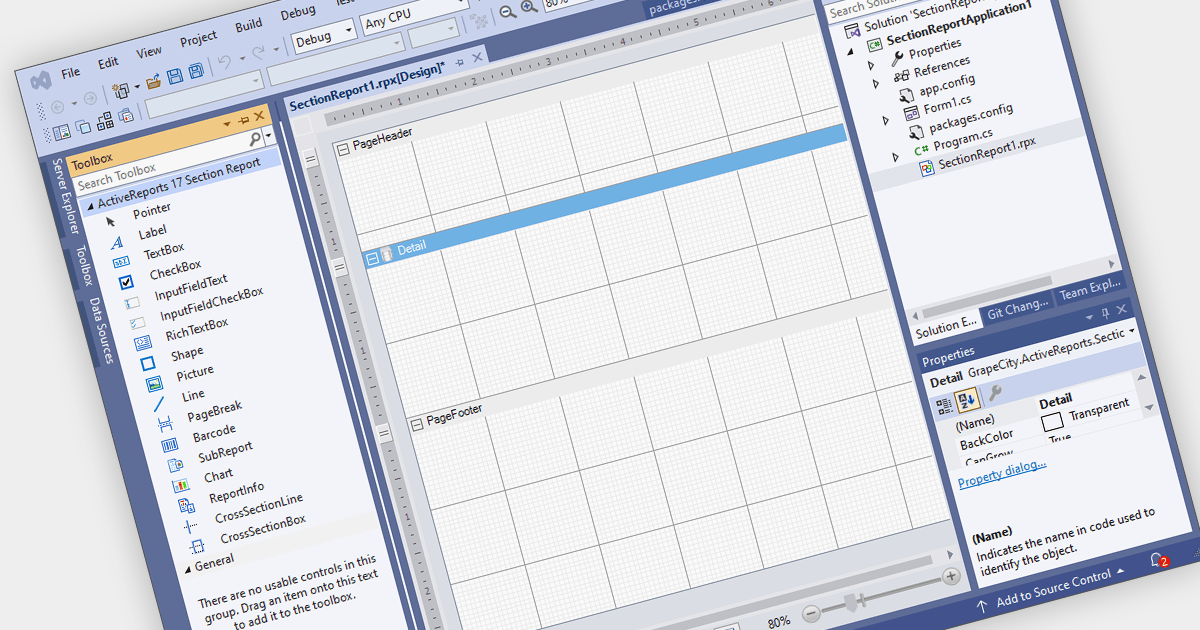
Visual Studio integrated report designers are comprehensive tools integrated into the Visual Studio development environment that enable software developers to design, create, and customize reports seamlessly within their projects. This feature streamlines the report creation process by providing a user-friendly interface for designing layout, formatting data, and integrating data sources directly within Visual Studio. Its benefits include increased productivity through the elimination of the need for external tools, enhanced collaboration among development teams, and improved efficiency in report development workflows, ultimately leading to faster delivery of high-quality reporting solutions in software applications.
Several .NET WinForms reporting controls offer Visual Studio integrated designers, including:
For an in-depth analysis of features and price, visit our WinForms reporting controls comparison.
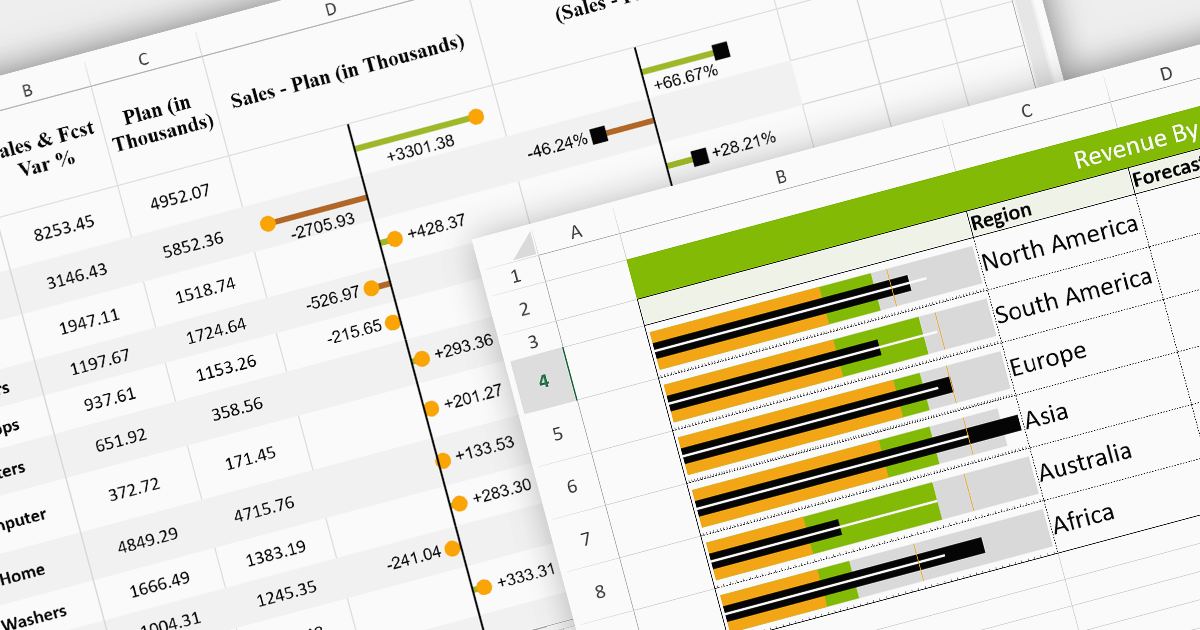
Sparklines are miniature charts embedded within the cells of a spreadsheet. Their compact size allows for dense visualizations, revealing trends and patterns in large datasets without sacrificing valuable screen space. Placed directly beside their corresponding data, they facilitate immediate comparisons and insights, enhancing understanding and communication. Their flexible nature allows for diverse chart types, from lines highlighting trends to columns showcasing comparisons, making them adaptable to various data presentations.
Here are some React spreadsheet controls that offer sparkline functionality:
For an in-depth analysis of features and price, visit our comparison of React spreadsheet controls.
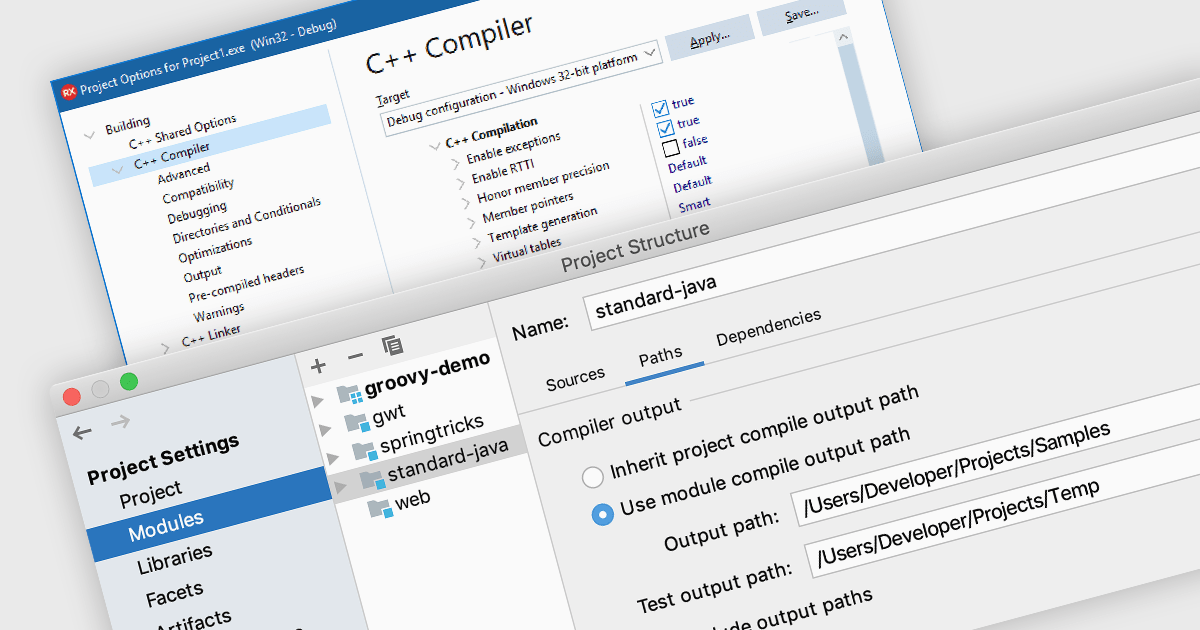
A code compiler transforms source code from high-level programming languages, such as Python or C++, into machine code that the CPU can directly understand. This process involves several steps, including lexical analysis, parsing, semantic analysis, optimization, and code generation. This allows programmers to create complex applications without needing to write directly in machine code, and the resulting program can operate on specific hardware or operating systems.
Several Integrated Development Environments (IDEs) offer a compiler, including:
For an in-depth analysis of features and price, visit our comparison of IDEs.

A range trackbar component, also known as a range slider, expands upon the standard trackbar by allowing users to select a range of values within a predefined minimum and maximum, instead of just a single point. This is achieved through two independent sliders or markers that define the lower and upper bounds of the chosen range. Range trackbars are commonly used in applications requiring filter selection, price range specification, or any scenario where choosing a continuous segment within a broader spectrum is necessary.
Several Blazor Data Editor controls offer range trackbars including:
For an in-depth analysis of features and price, visit our Blazor data editors comparison.





Tél : (888) 850 9911
Fax : +1 770 250 6199


