


Fournisseur officiel
Comme nous somme les distributeurs officiels et autorisés, nous vous fournissons des licences légitimes directement à partir de 200+ éditeurs de logiciels.
Voyez toutes nos marques.
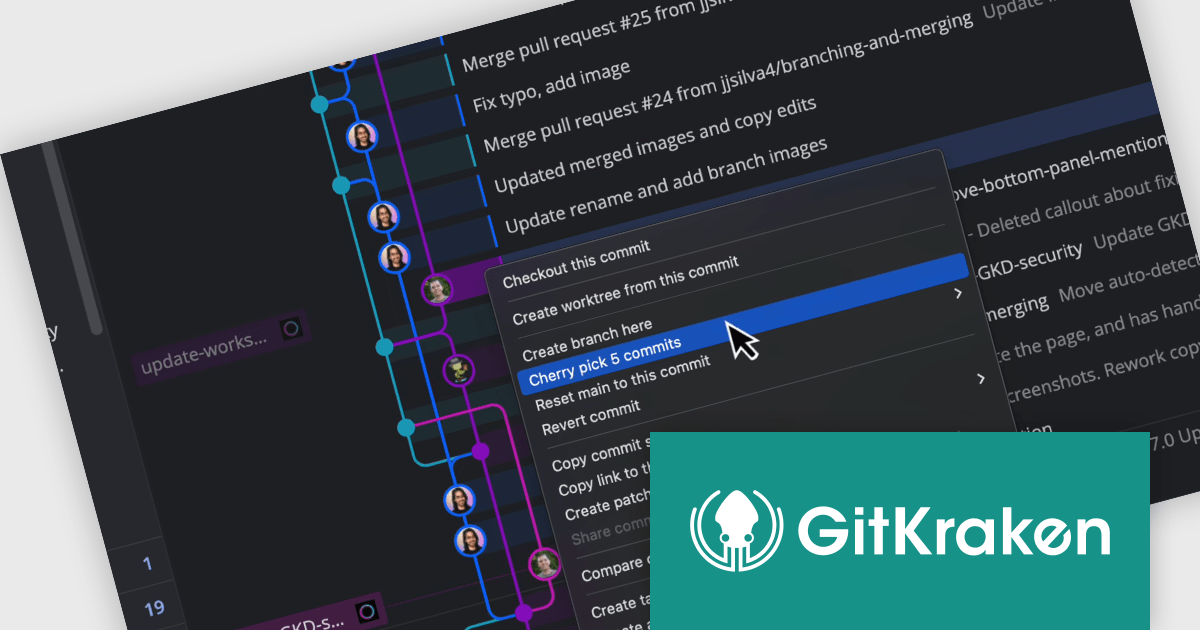
GitKraken is a suite of developer tools built around Git, a popular version control system. It offers a graphical user interface (GUI) that allows developers to interact with Git repositories visually instead of relying on the command line. This simplifies complex Git workflows like resolving merge conflicts and visualizing code history, making Git more accessible and efficient for developers of all experience levels.
The GitKraken Desktop V10.8.0 release adds the ability to cherry pick multiple commits, enabling users to easily grab multiple commits in one action, reducing repetitive steps when applying changes across branches. This feature is a significant time-saver for developers working across branches, allowing them to efficiently apply bug fixes, synchronize feature branches, or manage hotfixes, ensuring that changes are propagated quickly and accurately.
To see a full list of what's new in V10.8.0, see our release notes.
GitKraken Desktop is licensed per user as an Annual license with free updates and technical support. See our GitKraken licensing page for full details.
Learn more on our GitKraken product page.
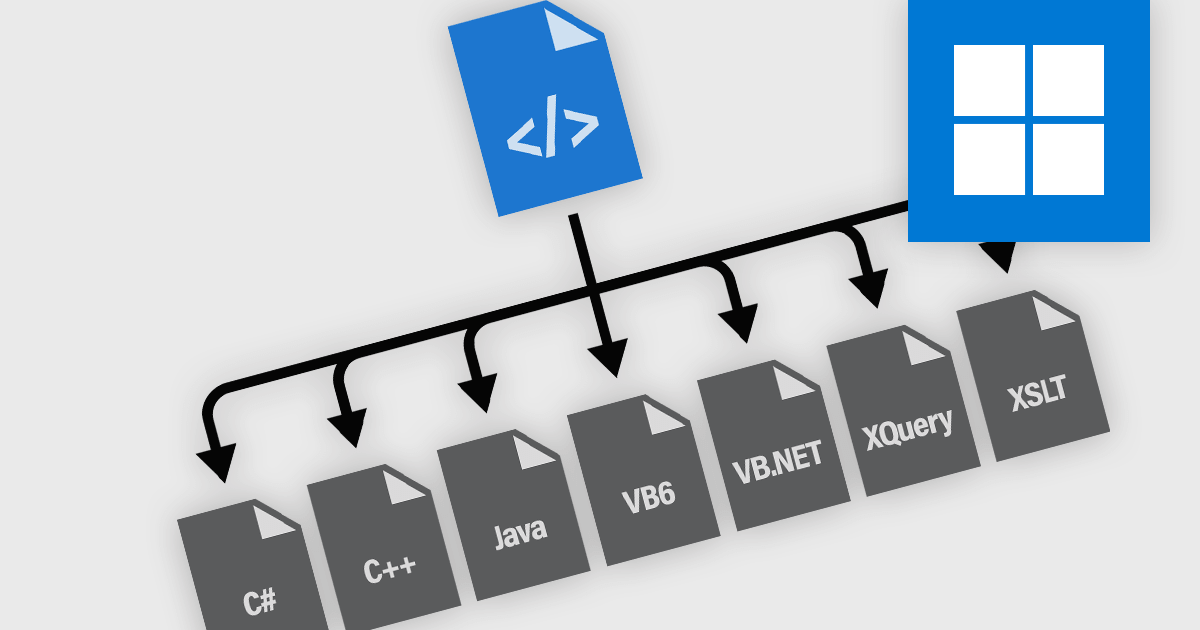
Code generation in Structured Document Tools enables the automatic creation of source code from predefined templates, schemas, or structured content. These tools streamline the development process by transforming high-level document structures into executable code, reducing manual effort and minimizing errors. They are widely used in domains where structured data needs to be processed, such as report generation, database queries, and transformation pipelines. By integrating code generation into document workflows, developers can ensure consistency, enforce standards, and accelerate development across multiple programming languages and environments.
Common languages supported include:
For an in-depth analysis of features and price, visit our structured document tools comparison.
ComponentSource and InfoSoft Global have partnered since 2005 to deliver high-quality data visualization solutions that empower developers to turn raw data into clear, actionable insights. This long-standing collaboration reflects a shared mission to enhance productivity and simplify complex data through powerful, interactive visual tools.
InfoSoft Global is a leading provider of visual web applications and solutions, with a strong focus on building advanced data visualization products for Microsoft SharePoint. Their solutions help users transform data into meaningful visualizations that work seamlessly across desktops and mobile devices, enabling quick insights and better decision-making at every level.
Over the years, ComponentSource has played a key role in bringing InfoSoft’s innovative products including Collabion Data Grid for SharePoint and Collabion Charts for SharePoint to a global audience. As a trusted distributor of software components and development tools, ComponentSource has helped expand InfoSoft’s reach, ensuring that developers worldwide have access to cutting-edge visualization tools that integrate effortlessly with SharePoint environments.
As we mark this 20-year milestone, we celebrate our shared success and look forward to continuing our partnership, providing smart visual solutions that drive clarity, insight, and business growth.
Learn more about InfoSoft Global.
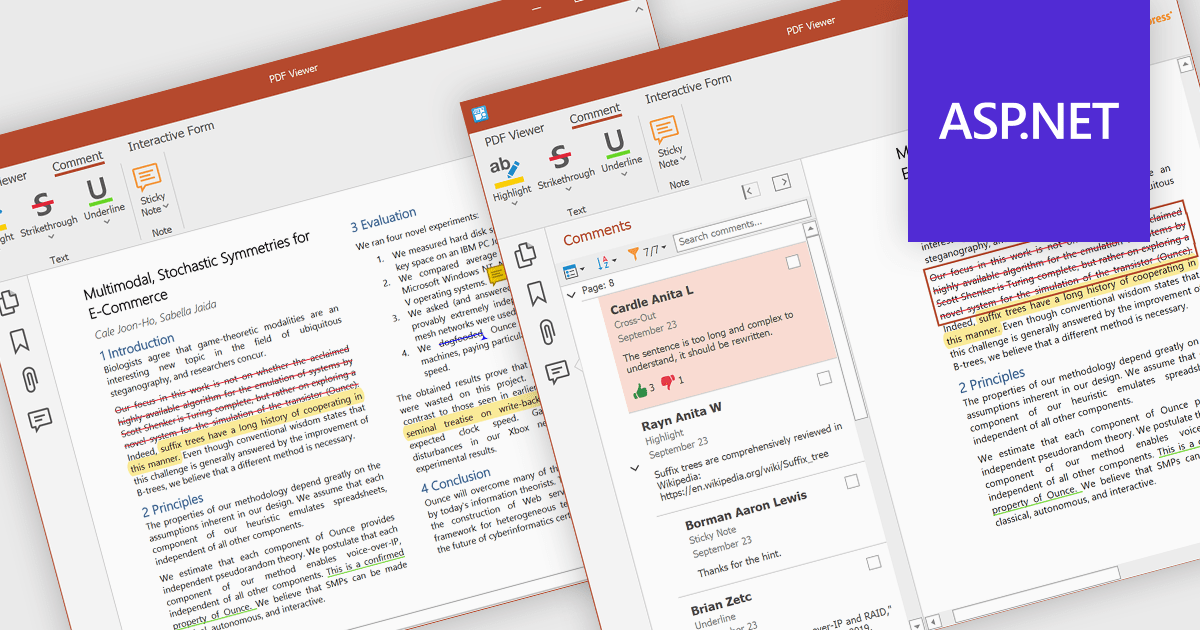
PDF sticky note annotations allow developers to enable users to attach virtual notes to specific locations within a PDF document. These annotations appear as icons that can be clicked to reveal additional text-based comments or instructions. This feature is particularly useful for collaborative workflows, review processes, and documentation tasks, as it enables users to provide contextual feedback without altering the original content. For developers, it offers a straightforward way to integrate lightweight commenting functionality into document-centric applications, enhancing usability and facilitating more efficient communication among users.
Several ASP.NET Core PDF components offer sticky note annotations including:
For an in-depth analysis of features and price, visit our ASP.NET Core PDF components comparison.

dbForge Schema Compare for Oracle is a powerful tool designed to help database developers and administrators efficiently manage schema synchronization and version control. It streamlines the process of identifying differences between database structures, ensuring consistency across environments. With support for automated comparison and deployment, the tool simplifies database maintenance and reduces the risk of errors when applying changes. Its intuitive interface, seamless integration with Oracle databases, and command-line capabilities make it a valuable asset for teams working with complex database infrastructures.
The dbForge Schema Compare for Oracle V6.0.85 release adds a new visual Object Filter, enhancing the flexibility and precision of schema comparison by allowing users to exclude specific objects based on custom criteria. This feature simplifies synchronization by focusing only on relevant changes, reducing the time and effort needed to manage large or complex schemas. By saving custom filters to files, users can easily reuse configurations across multiple projects, ensuring consistency in filtering criteria. Additionally, the ability to apply these filters from the command line, makes it easier to maintain Oracle databases in CI/CD pipelines and other scripted environments.
To see a full list of what's new in V6.0.85, see our release notes.
dbForge Schema Compare for Oracle is licensed per developer and is available as an Annual or Perpetual License with a 12 month support and maintenance subscription. See our dbForge Schema Compare for Oracle licensing page for full details.
dbForge Schema Compare for Oracle is available individually or as part of dbForge Compare Bundle for Oracle.


Tél : (888) 850 9911
Fax : +1 770 250 6199


