


Fornitore ufficiale
In qualità di distributori ufficiali e autorizzati, forniamo licenze software legittime direttamente da più di 200 autori di software.
Vedi tutte le nostre marche
Continua a leggere in inglese:
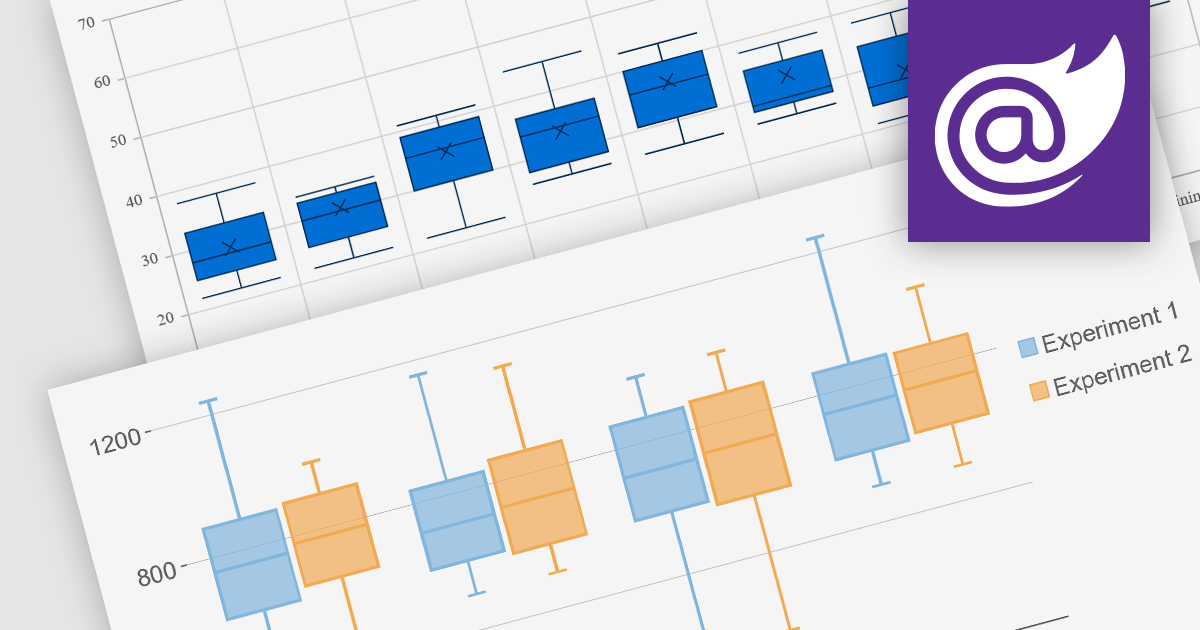
Box plots, also known as box-and-whisker plots, are used to display the distribution of a dataset. They show the median, quartiles, and extremes of the data, providing a quick visual summary of the data's central tendency and variability. This makes them particularly useful for statistical analysis and comparing data across categories.
Several Blazor chart controls offer Box plots including:
For an in-depth analysis of features and price, visit our Blazor chart controls comparison.


Tel: (888) 850 9911
Fax: +1 770 250 6199


