


Fornitore ufficiale
In qualità di distributori ufficiali e autorizzati, forniamo licenze software legittime direttamente da più di 200 autori di software.
Vedi tutte le nostre marche
Continua a leggere in inglese:
jQWidgets is a comprehensive JavaScript UI framework offering a robust collection of over 60 widgets, themes, and utilities for building professional-grade, cross-platform web applications. Built on jQuery, HTML5, and CSS, it provides extensive functionality including data grids, charts, navigation, input validation, and more. jQWidgets simplifies web development, ensuring your applications work seamlessly across desktop browsers, tablets, and smartphones.
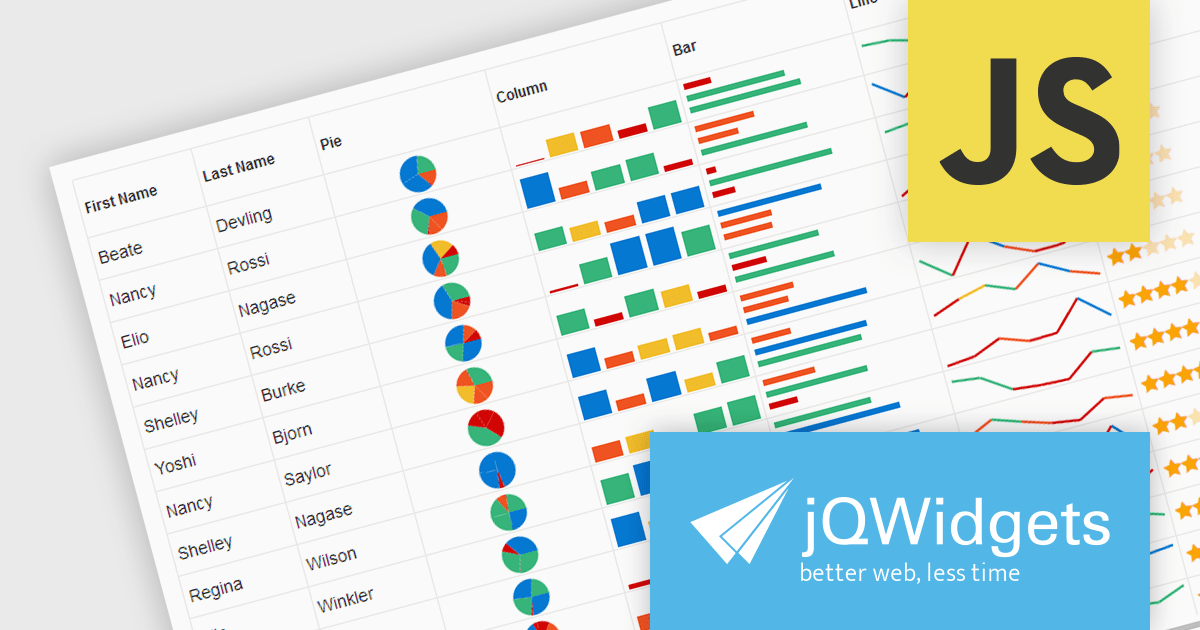
The jQWidgets v19 release introduces support for integrating sparklines directly into jqxGrid. These miniature charts, plotted directly within grid cells, provide a quick and insightful way to visualize trends and patterns in your data without requiring additional charting libraries. This enhancement significantly bolsters jqxGrid's data visualization capabilities, allowing you to create more informative and engaging data presentations.
To see a full list of what's new in v19.0.0, see our release notes.
jQWidgets is licensed per developer and is available as a Perpetual license 1 year support and maintenance. See our jQWidgets licensing page for full details.
Learn more on our jQWidgets product page.


Tel: (888) 850 9911
Fax: +1 770 250 6199


